PlanePlotter Report
PlanePlotter Report with text output
This is a toolkit of programs and a command script to produce and e-mail daily mode-S logs from PlanePlotter automatically. The default single-date/time format is acceptable to Alexis's Robot for log checking hex => registration purposes.
You need to make PlanePlotter create daily reports in SQLite format.
- Menu: File => Report => Setup report format
- Set: Automatic reports at intervals of 0 minutes
- Check: Create daily first/last database
- Check: Report only local aircraft
- Click: OK
These reports will appear in the designated PlanePlotter Log Files directory, and will have file names such as: pp_report2016100300.sqb (previously: pp_report20140612.sqb)
As this is free software, support is via a self-help group:
https://groups.io/g/planeplotter
![]() Download: MakePlanePlotterReport.zip
(remember to right-click, Properties, Unblock after download)
Download: MakePlanePlotterReport.zip
(remember to right-click, Properties, Unblock after download)
| V2.0.0 | 2012-Feb-20 | More user-friendly format, splits Hex/Callsign/Reg into separate fields. |
| V2.1.0 | 2012-May-29 | Update for PlanePlotter 6.2.6.5, report name changed from pp_report20120527.sqb to pp_report2012052800.sqb |
| V2.1.1 | 2013-Feb-27 | Add example of multiple e-mail recipients. |
| V2.2.0 | 2014-Jan-28 | Add option for both first and last times. Uncomment: set PPReportBothTimes=Y |
| 2014-Apr-13 | Note what directory to use for "Start in". | |
| 2014-Jun-13 | Add note about using SSL for e.g. gmail servers. | |
| V2.2.1 | 2016-Oct-03 | Make date string more user-friendly. |
| V2.2.2 | 2016-Nov-09 | Ignore hex codes with "?", likely satellites. The program SplitFields.exe has been updated. |
| V2.3.0 | 2020-Apr-05 | Allow for extended 14-character routes. The file sql_commands.txt has been updated. The program SplitFields.exe has been updated. Output format around "routes" is slightly different. |
| 2010-Jan-21 | 2021-Jan-21 Add note on Conditional Expressions |
But I want to make reports for days other than "yesterday"
In the script, the command GetYesterday can take a parameter specifying the number of days offset from today, which by default is -1, giving "today-1" i.e. yesterday, so making the line:
for /f "tokens=*" %%i in ('GetYesterday -2') do set YESTERDAY=%%i00
would look for a report for the day before yesterday and so on. Note the space between the GetYesterday and the -2. You could try +0 for today's report (untested). Alternatively, putting:
set YESTERDAY=2013072200
after the GetYesterday line would force a fixed date of 20130722 (don't forget to add the "00" to match the report .sqb name).
I do suggest turning off the mailing part of the script before you try this!
PlanePlotter Report with Web output
Dave Giffney writes:
Bev has been in contact and with a little of his help the script is better, and now v2.
The Web outputted page now has the column data correctly separated and formatted.
As a by-product of this, have tweaked your text output to use new .vbs file so the first column also is split into three separate
columns.
Download: MakePlanePlotterReport-Web-V2.zip (remember to right-click, Properties, Unblock after download)
Update
You may need to make the change for the new log naming convention when using the above, as it hasn't been updated by the author. If you like to update your own copy by hand, it's a simple edit to change:
for /f "tokens=*" %%i in ('GetYesterday') do set YESTERDAY=%%i
to:
for /f "tokens=*" %%i in ('GetYesterday') do set YESTERDAY=%%i00
at or around line 40. I.e. add "00" (two zero characters) after the
"%%i".
PlanePlotter Polar Plot
You may find the Polar Plots produced by PlanePlotter quite handy for monitoring changes to antennas in particular any blockages in particular directions. Enable this with the View, Polar diagram... menu. Do remember to try to get your antenna as high as possible, with as clear a view of the horizon as possible. You can see from the plots below that I have a blockage in the SW-SSW direction caused by the local Pentland hills.
I wrote a ![]() simple program to plot the data, and it can plot the raw data as shown
below. Just drag and drop the polardata.bin file found in your PP Log
files folder onto the program and you should get a plot like the one
below. If you get a message about missing DLLs when trying to start the
program, please download and install my runtime Library
Bundle.
simple program to plot the data, and it can plot the raw data as shown
below. Just drag and drop the polardata.bin file found in your PP Log
files folder onto the program and you should get a plot like the one
below. If you get a message about missing DLLs when trying to start the
program, please download and install my runtime Library
Bundle.
Update 2021-May-05:
- The program now accepts up to 8 files being dropped, and displays them in various colours.
- You can instead specify up to eight filenames on the command line.
- You could make up a number of command scripts to plot different sets of files.
- The file names are displayed as hints on the range list
- Files and folders with spaces are accepted
- The program's location is retained across runs
- The plot aspect ratio is always 1:1, even on squat 1920:1080 monitors.
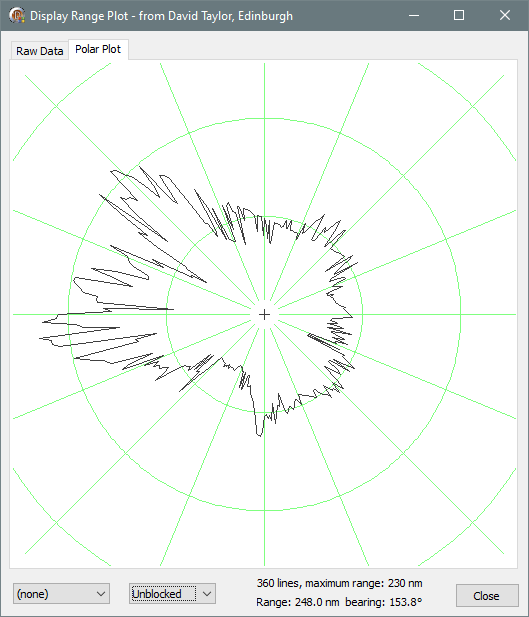
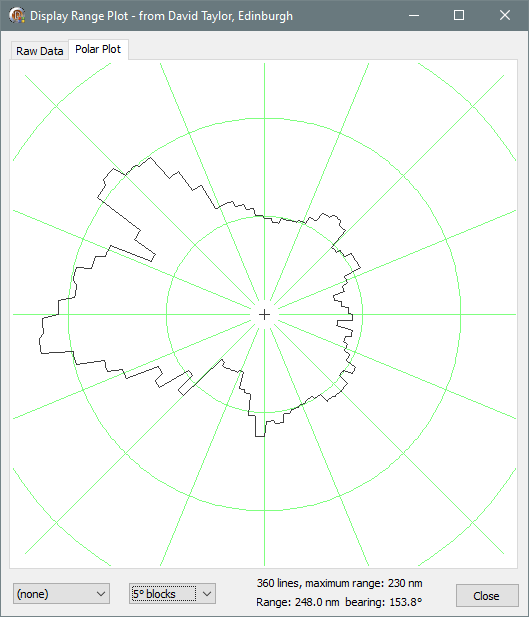
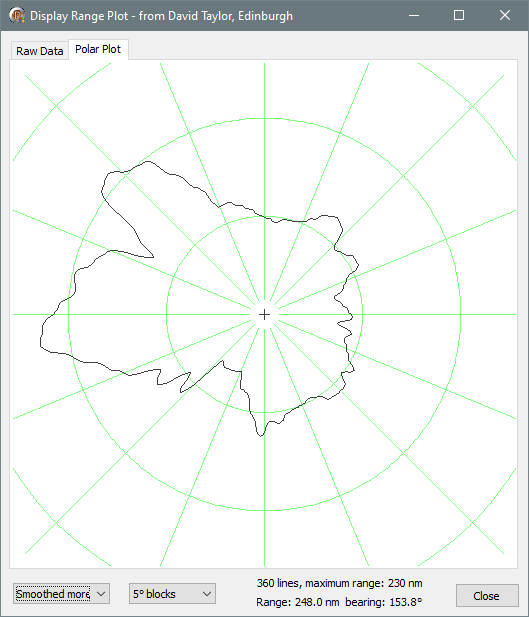
However I felt that for my location, simply plotting the values every degree (0
to 360) produced a plot which was rather jagged, so I added a couple of features
to the program to smooth the plot. First, I tried binning the values into
larger angular chunks, so the first plot below shows binning into 5 degree
cells, where the maximum value within that cell is plotted. There is also
a smoothing function to further reduce the blockiness. Use it if you wish.
 |
 |
Coverage and 1.09 GHz RF filter notes
For my coverage and 1.09 GHz RF filter notes please see
this page.