|
|
Win-7/64 i5-760 PC - Alta
DVBWorld USB box
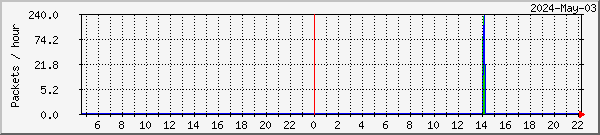
Missed packets
Recovered packets
|
|

|
Test PC - Hydra
SkyStar2 V2.6D PCI card
Missed packets
Recovered packets
|
|
Click on a graph for weekly, monthly and yearly data
|
|
This data is snapshots of the TelliCast statistics display. The
numbers are rather small, and packets per day would be the best display scaling,
but MRTG only offers packets per hour at best. Therefore, it's possible
that for the backup PC, at least (which just takes Meteosat-8 rapid-scan and
Meteosat-9 full-scan), the
recovered packets may stay at zero for the display, rather than their actual
non-zero value. This appears to be the best that can currently be done.
 |
Main PC - Feenix
SkyStar2 V2.6D PCI card
Receiving:
MSG-2, free DWDSAT
EARS-AVHRR
& Metop-AVHRR |

|
Test PC - Hydra
SkyStar2 V2.6D PCI card
Receiving:
MSG-2,
EARS-AVHRR &
all Metop-A data |
|
|
Win-7/64 i5-760 PC - Alta
DVBWorld USB box
Receiving:
MSG-2, Metop-AVHRR
& EARS-AVHRR |
|
Click on a graph for weekly, monthly and yearly data
|
|
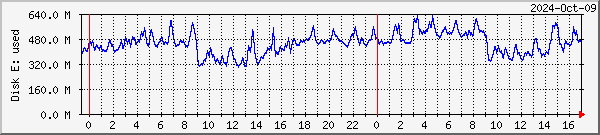
The size of the FSY file (or files) gives an indication of the amount of data
being temporarily buffered from the DVB stream. It will be larger if more
data is configured (e.g. for Metop as well as Meteosat-9), and it can also be
larger if the receiving system is less than optimally configured when data
segments which cannot be reassembled (because the data stream is incomplete) are
accumulated in the FSY file. During normal operation, the file will grow
during the first 24 hours of operation, and be reasonably stable after that.
Periods of data loss and the occasional transmission of large files (e.g.
VGT4Africa) can cause FSY file increases. There may be more than one FSY
file if you configure the recommended 300MB RAMdisk - it's the total size which
is plotted above.
For the TelliCast 2.5.17 client, FSY files are no longer used, so the space
occupied by the tmp_directory files on the RAMdisk or hard disk partition is plotted instead.
Large spikes here likely indicate TelliCast operation without the necessary data
managers being run, and very large spikes may be edited out to preserve the
normal-running information.
 |
Main PC - Feenix
SkyStar2 V2.6D PCI card
Receiving:
MSG-2, free DWDSAT
EARS-AVHRR
& Metop-AVHRR |

|
Test PC - Hydra
SkyStar2 V2.6D PCI card
Receiving:
MSG-2,
EARS-AVHRR &
all Metop-A data |
|

|
Win-7/64 i5-760 PC - Alta
DVBWorld USB box
Receiving:
MSG-2, Metop-AVHRR
& EARS-AVHRR |
|
Click on a graph for weekly, monthly and yearly data
|
|
- UK - north to south order
- David Taylor, Edinburgh, Scotland - map
- John Say, Cullercoats, Tyne and Wear - map
- Donald Martin, Billingham, Teesside - map
- Allan Gibbs, Prescot, Merseyside - map
- Alan Banks, Sandbach, Cheshire - map
- David Anderson, Loughborough, Leicestershire - map
- Nick Norman, Norwich - map
- James Brown, Porthcawl, Wales - map
- Francis Breame, Surrey - map
- Denmark
- Copenhagen, Institute of Geography - map
- Belgium
- Daniel R. Hurtmans, Brussels - map
- Italy - north to south order
- Giuseppe Cico, Turin - map
- Nicola Sebastiani, Alessandria near Genoa - map
- Maurizio Calvitti, Anguillara near Rome - map
How can I set up similar monitoring on my own system? More information
on monitoring EUMETCast and using
MRTG for monitoring other information.
TelliCast and the network throughput.
The way the DVB and TelliCast system works - in a nutshell - is this.
The data from the satellite is tagged with a packet identifier called the PID, and
using the setup for your DVB card or box you can choose which PIDs the card should handle.
As there are only a limited number of PIDs which some DVB cards can handle, the
PID is used as a rather coarse-level control to break the data stream down into
reasonable-bandwidth chunks. The data is sent from the DVB card to the
TelliCast receiving program as an IP multicast stream, delivered over
UDP
for best efficiency, but meaning that delivery isn't guaranteed, hence the susceptibility of the system
to interruptions by high CPU, disk and network loading.
The data is further divided into streams by using "channel
names". Here are the channel
names for EUMETCast. A single PID may contain a number of different streams, but
each stream will have a different multicast address. The multicast address
of the "Announcement channel" stream is fixed, and that channel talks
to the TelliCast program saying what data is available. If you have
configured the TelliCast program to accept a particular data channel (e.g.
EUMETSAT Data Channel 2 - for the HRIT data), and you are allowed access by your
eToken, when new data is available for that channel the TelliCast program will
"join" the multicast being sent out via the DVB software, and when the
DVB software finds a "joined" channel (i.e. one with some listeners),
it will send out the data packets for that stream to the appropriate multicast
address.
In computer networking terms, the packets originate from a multicast network
224.0.0.0 with a netmask 240.0.0.0. For example, for [Metop AVHRR] data,
the source address is 224.223.222.239:2390. The TelliCast software has the
address of an "announcement channel" set by its recv.ini file, which
also contains the address of the network interface (typically
192.168.238.238). So the TelliCast software should be able to join a
multicast group on the specified interface. One thing which some DVB software appears to omit is the
command to tell Windows that any request for the multicast network (224.0.0.0)
must be routed via the DVB virtual network interface (192.168.238.238), and you
may need to add that route with a manual
command. However, as the
TelliCast software already knows exactly which interface to use, why you even
need the route command is not yet clear..... More
about multicast programming. The recv-channels.ini file will determine
whether or not TelliCast accepts a particular set of data announced by the DVB
network. If that data isn't accepted, the network interface doesn't send
it, and it won't appear on the flow reported by the DVB pseudo-network (although
this behaviour appears to differ between the SkyStar PCI and Dexatek/DVBWorld USB
software).
Perhaps this is handled by having more than one multicast group associated with
the TelliCast software. Perhaps there is one group per data channel?
Multicast Mechanics.
It is the sum total of data sent to active multicast channels which is
plotted above as "throughput". Note that as some of the data is
compressed internally to the TelliCast software, the network throughput between
the DVB interface and the TelliCast software may be less than the data throughput
reported by the TelliCast software. To reduce the load on your PC,
you can either disable individual PIDs in the DVB software (right-click the
green satellite icon  ,
Setup4PC, Data Services), or you can select the channels you want by editing the
recv-channels.ini file in the TelliCast software.
,
Setup4PC, Data Services), or you can select the channels you want by editing the
recv-channels.ini file in the TelliCast software.
- 11:50 UTC, Wednesday, 2012 Jan 18, week 3. Replaced Dexatek box on
PC Gemini with SkyStar USB 2 box for testing. It works fine.
Noted a higher than expected CPU after doing so, and it was the Theater
Manager from the DVBWorld install, so removed its startup using MSconfig.
- 14:50 UTC, Wednesday, 2011 Jan 26, week 04. Removed snow shield from
the dish. The transparent plastic shield part had broken, leaving the
flat support on the LNB arm, which tended to increase the likelihood of snow
accumulating. Also sprayed the LNB and arm top with Teflon spray as
recommended by Arne van Belle.
- Monday, 2011 Jan 24, week 04. Replaced the V2.3 SkyStar card in PC
Stamsund with a V2.6D version, as Stamsund had been showing a
higher-than-expected missed packet rate. Took a lot of the day to
change this card as there were issues with the network card which I also
tried to change. Reverted back to the PCI network card rather than use
the on-board networking. Remembered to set the card speed down to
100Mb/s.
- Tuesday, 2011 Jan 11, week 02. Installed DVBWorld box onto PC Alta
for EUMETCast test service.
- Monday, 2011 Jan 10, week 02. PC Molde removed from EUMETCast
service.
- 07:00 UTC, Thursday, 2010 Dec 09, week 49. Both PC Gemini and PC Molde were
moved, and so powered down for a period. Accidentally pulled the cable from the
horrid F-connector on Stamsund during the move, so some data loss there.
- 09:40 UTC, Wednesday Dec 08, week 49. Large burst of missed packets
from EUMETCast seen across Europe. These were so big that they would
have swamped the normal data, so have been erased from the log files.
- 03:00 onwards UTC, Sunday, 2010 Nov 28, week 47. Heavy snow blocked
the LNB and so signal loss. There was also a reduced signal strength
period early yesterday morning from about 23:00 Friday 26 to 00:50 Saturday
27. More misery on Monday 29th - screen-shot
and photo.
- 2010 Nov 16-17-18, week 46. USB box indication now provided from
the same Dexatek box, but on PC Molde while PC Gemini is out of action with
a broken chipset fan.
- 09:30 - 10:30 UTC, Thursday, 2010 Oct 14, week 41. Due to the
electricity supply meter being changed, there was an enforced power-off
during this period, and hence start-up glitches and apparent signal loss
from the various PCs. The next day, I noted an increase in the disk
usage on PC Stamsund, and perhaps this is caused by some old temporary
files. TrimTree wasn't run regularly on that PC (but it is
now!). Need to check tomorrow, and confirmed, on Gemini the existing
TrimTree picked it up, and on Stamsund the added TrimTree tidied the extra
data. Something like that is needed for the new 2.5.17 client PCs.
- Friday, 2010 Aug 27, week 34. Quite bad EUMETCast losses - two
signal dropouts from Usingen, and multiple missed (and many not recovered)
packets during the day, seen
across Europe. Effects
on the FSY size and tmp_directory size ( (TelliCast 2.4.4a and.2.5.17
clients respectively).
- 07:41 UTC, Friday, 2010 Aug 27, week 34. Restored Gemini to normal
operation with Plane Plotter etc. Too many external losses to make a
good evaluation of small packet loss changes.
- 10:00 UTC, Thursday, 2010 Aug 19, week 33. As an experiment on
Gemini, I have stopped all Plane Plotter related activity, to see what
effect it might have on the missed packet rate. Will need to leave
this off for several hours to make a judgement, possibly even a whole day.
Not convinced it made any difference. 11:26 UTC unplugged the SBS-1 feed as
well.
- 23:33 UTC, Tuesday, 2010 Aug 17, week 33. Critical dongle error on
Hydra.
- 10:55 UTC, Tuesday, 2010 Aug 17, week 33. On PC Gemini, move
tmp_directory back to HD in view of yesterday's events, but reformatted
drive T: to be FAT32 rather than NTFS. Needed to shrink the partition
to under 32GB. This resulted in a 69MB NTFS system overhead being dropped,
visible in the disk usage graph.
- Monday, 2010 Aug 16, week 33. Europe-wide missed packets from
EUMETSAT 15:00-18:00 UTC.
- 15:35 UTC, Thursday, 2010 Aug 05, week 31. Europe wide event (screen-shot)
with high missed packet rate decaying over the next ~2.5 hours. PC Stamsund
(MSG-1 & MSG-2 only) showed all 161 packets to be recovered. There was a
high throughput peak at the time on the DVB USB box (no hardware PID
filtering), but not higher than ones before or after. PC Stamsund
showed a lower and flatter throughput from about 16:30 onwards, but that may
not be related and may be just the lack of MODIS-L1 data. PC Gemini
showed a large increase in the data in the tmp_directory and \received\
directories (on a scratch disk), decreasing from a maximum at 15:30 to
nominal at 18:00. PC Stamsund (MSG-1 and MSG-2 only, but including the
MODIS-L1 data on [Data Channel 4]) showed a lower and much flatter
tmp_directory+\received\ usage between about 16:40 and 22:00.
- 13:08 UTC, Monday, 2010 Aug 02, week 31. Installed TelliCast 2.5.17
client on PC Stamsund, to almost-clean FAT32 partition, drive D:, excluded
from mstDefrag.
- 07:50 UTC, Saturday, 2010 July 31, week 30. Installed TelliCast
2.5.17 client on PC Hydra, tmp_directory and \received\ tree on NTFS
partition, drive T: excluded from mstDefrag.
- 11:10 UTC, Friday, 2010 Jul 23, week 29. Installed new (pre-release)
TelliCast client on PC Gemini (chosen because of its higher missed packet
rate). As EUMETSAT suggested, uninstalled the older TelliCast client
first. Note that all files in the tc-recv.exe directory are deleted
whether the install put them there or not! Make sure you have a
backup! Kept the same recv-channels.ini configuration, and only changed
the default EUMETSAT-supplied settings in recv.ini to: reduce the log to
"quiet" level, include my existing error_restart script, and point
the tmp_directory to RAMdisk. Changed the RAMdisk monitoring script to
report the disk space used instead of the FSY file size (as there are no FSY
files with the new client), and removed the "unscaled" option so
that the natural maxima show more clearly.
- 07:15 UTC, Wednesday, 2010 Jun 30, week 26. Configured Hydra back to
MSG-2+AVHRR+Metop operation as it was before April 29, week 17. From
experience learnt during the tests, increased the RAMdisk from 350MB to
600MB, and put the tmp_directory on that RAMdisk, to see whether errors are
reduced in this system configuration. Restarted tc-recv.exe at 07:30
to clear out errors during startup.
- 05:57 UTC, Wednesday, 2010 Jun 30, week 26. Restarted TelliCast on
Stamsund with the tmp_directory back on the RAMdisk, as there seemed to be
one or two odd missed and recovered packets since the change, and a whole
lot of unexplained missed packets after the Rapid Scan stopped early
yesterday! Seemed to be a set of Message Lost messages in the log file
around the times of the errors - nothing in the Event Logs. Also noted
an entry for missed data when I saved the recv.ini file - strange as I
thought that the recv.ini file was only read at startup - but no, the Log
Level is read continuously. From the log file:
MSG:2010-06-30 05:38:37.227:Log level is "normal".
MSG:2010-06-30 05:38:37.279:Disconnect from data channel `EUMETSAT Data Channel 9', address 224.223.222.251:2510 completed (parameter change)
MSG:2010-06-30 05:38:37.287:File transmission 4c2ad84f0164bfc5 ended/interrupted: 1 file missing/incomplete
MSG:2010-06-30 05:38:37.287:File transmission 4c2ad8560164c000 ended/interrupted: filelist missing/incomplete
MSG:2010-06-30 05:38:37.290:Disconnect from data channel `EUMETSAT Data Channel 9', address 224.223.222.251:2510 completed (channel closed)
MSG:2010-06-30 05:38:37.290:Disconnect from announcement channel `TSL Announcement Channel', address 224.223.222.223:4711 completed (parameter change)
MSG:2010-06-30 05:38:37.291:Disconnect from data channel `EUMETSAT Data Channel 2', address 224.223.222.21:2511 completed (parameter change)
MSG:2010-06-30 05:38:37.295:Missed parts of file `H-000-MSG2__-MSG2________-HRV______-000014___-201006300530-C_' id 4c2ad84f0164bfc4 from channel `EUMETSAT Data Channel 2'
MSG:2010-06-30 05:38:37.322:Connected to announcement channel `TSL Announcement Channel', address 224.223.222.223:4711 (announcement channel)
MSG:2010-06-30 05:38:39.617:Channel "TSL Announcement Channel": Lost message 2054502 (message lost)
Noted that the FSY files were reused after the restart.
- 06:01 UTC, Tuesday, 2010 Jun 22, week 25. Restarted TelliCast on
Stamsund with the tmp_directory back on the hard disk, just to see how well
or how badly it performs. It seems that changing the network card speed
was the major improvement. Left the RAMdisk at the same size in case we need
to move tmp_directory back.
- 05:58 UTC, Sunday, 2010 Jun 13, week 23. Reset TelliCast on Stamsund
so that the \received\ directory was back on hard-disk rather than on the
RAMdisk. RAMdisk size left unaltered for now, as the tmp_directory is
still on the RAMdisk. After a week, my impression is that this has
changed the missed/recovered packet rate from near-zero to, perhaps, 0, 1 or
2 missed & recovered packets per day. This should not have any
overall effect on TelliCast as it is able to recover the missed packets, but
it does mean that TelliCast is having to work a little harder. Other
externally-caused outages during this period make this conclusion rather
less certain. Although I did at one stage think that the CPU for
tc-recv.exe had increased after the change, it seems to be within the limits
of the normal weekly variation.
- 17:25 UTC, Wednesday, 2010 Jun 09, week 23. Reduced the LAN speed on Gemini
from "auto-negotiate" to 100Mb/s full-duplex, just to see whether
it might affect the packet loss rate. No obvious effect - if anything
a little worse.
- 10:40 UTC, Tuesday, 2010 Jun 08, week 23. Enabled DevCoCast-1
channel on Feenix and Gemini TelliCast, and on the respective MSG Data
Managers, as folks are enthusiastic about some of the data there.
- 15:47-16:03 UTC, Sunday, 2010-Jun-06, week 22. EUMETCast outage due
to bed weather over Usingen. Managed to reboot Feenix having installed
the Windows updates.
- 15:38 UTC, Sunday, 2010-Jun-06, week 22. Altered network card speed
on Stamsund down from 1Gb/s auto down to 100Mb/s full-duplex. Seems to
have eliminated packet loss.
- 06:20 UTC, Thursday, 2010 Jun 03, week 22. Noted a slight difference
in TelliCast throughput between Hydra and Stamsund, which are supposed to be
identical at the moment. Found that the test PID (513) was still on
Hydra, so removed it, and that Stamsund did not have [Channel-4] and
[BMD-RA-VI] in recv-channels.ini, so commented those out on Hydra.
- 05:58 UTC, Wednesday, 2010 Jun 02, week 22. Restarted TelliCast on
Gemini after adding an error_script just to log events.
- 03:40 UTC, Wednesday, 2010 Jun 02, week 22. On Stamsund seems to to
have been a burst of missed packets lasting some 15 minutes. At 03:30
I had started collecting Crystal Symphony Web cams. 04:05..04:20
considerable increase in FSY file size.
- 08:55 UTC, Tuesday, 2010 Jun 01, week 22. Noticed that
TheaterMgr.exe was still running, and using quite a bit of CPU (about
50% more than one MSG Data Manager!). Stopped it and removed it from
the Runs key with sysinternals AutoRuns. The change may be difficult
to see as the RSS is about to stop for two days, and that will drop CPU and
throughput.
- 04:30 UTC, Monday, 2010 May 31, week 22. Disabled the Windows
firewall on Stamsund, but it made no difference to the packet loss.
07:15 UTC, re-enabled the firewall and removed [channel 4] and [BMD-RA-VI]
from the files received. No difference. 07:35 -08:45 UTC,
stopped the NTP service for a test (as it was real-time) - no difference.
08:57 UTC, removed unneeded PIDs: 302, 509, 510 (leaving: 100, 300,301, 500).
This reduced the reported throughput, but had no effect on lost packets.
15:40 UTC moved the entire \received\ directory from the hard disk to the
RAMdisk, having made the RAMdisk now 600MB. 18:00 UTC restored the
SkyStar PCI card, as there seemed to be no way to reduce the USB box
losses. Even the receiver screen showed about 1
in 700 packets in error.
- 08:00-09:00 UTC, Sunday, 2010 May 30, week 21. Changed Backup PC
Stamsund from using a SkyStar 2.3 card to using a DVBWorld USB box.
Used the chance to install the latest Windows-7 Microsoft update
patches. Left the SkyStar physically in place, but changed its IP
address to .237 instead of .238. Needed to alter the MRTG quite a bit
to use DVBreport.exe for the signal strength (will be a differently scaled
graph - sorry about that - and for the changed network adapter numbers. Needed to
update the usage monitor program to include the "DVB World.exe"
program. May adversely affect timekeeping precision. This
produced a much higher missed packet rate, so at 14:30-14:45 UTC I
physically removed the SkyStar card and rebooted. Around 19:00 UTC,
changed the logging from Normal to Quiet, but no obvious improvement.
- 15:30 UTC, Friday, 2010 May 28, week 21. Changed PC Hydra's
EUMETCast and processing configuration to match that of Stamsund, to get comparative
losses prior to perhaps making one of these PCs have its received data
purely on RAMdisk. At the point of changeover, Hydra had two missed and
two recovered packets since 05:55 UTC this morning (all PCs across Europe
had seen a burst 06:00 to 06:10 UTC). PC
performance screenshot across the changeover.
- 06:40 UTC, Tuesday, 2010 May 25, week 21. Increased Gemini's RAMdisk
to 512MB, using the Gavotte RRAMdisk. This may have reduced the missed
& recovered segments slightly, but no major change.
- 06:05 UTC, Thursday, 2010 May 20, week 20. Increased the size of Stamsund's RAMdisk
from 300MB to 450MB, and in recv.ini, pointed tmp_directory =>
Z:\receiving\temp. This is an experiment to see whether the packet
loss is reduced - we only expect the larger files to be stored in this
temporary directory while being built up. Having reviewed eight days,
my feeling is that this has made no difference eight way - neither better
nor worse.
- 14:15 UTC, Thursday, 2010 Apr 29, week 17. Revised configuration on
Test PC Hydra to be pure RSS in preparation for Section Packing test next
week.
- 08:45 UTC, Tuesday, 2010 Mar 30, week 13. Updated SkyStar driver on
Stamsund from 4.5.0a beta to 4.5.1.
- Wednesday, 2010 Mar 24, week 12. PC Hydra updated to 64-bit
Windows-7, earlier statistics lost. Later, successfully installed the
V4.5.1 SkyStar drivers and software (73MB download!), and used the newer 28,672-byte
B2Status.exe with the MRTG performance monitoring software.
- Thursday 2010 Jan 21 to Friday 2010 Jan 22. Arne van Belle noted a
higher rate of Announcement Channel lost message reports, perhaps as a
result of a EUMETSAT change. Some
graphs are here.
- 14:20 UTC, Thursday, 2010 Jan 14, week 02. Added [SAF-Global] to all
four recv-channels.ini files.
- 13:24:35.111 - 13:25:24.195 UTC, Monday, 2010 Jan 11, week 02.
"Message lost" and "missed parts of file" reports on
Stamsund. All four PCs saw non-recovered missed packets, reported at
13:25-13:30. Perhaps some melting snow fell from the roof onto the
LNB?
- 06:40 UTC, Tuesday, 2010 Jan 05, week 01. Updated the FSY recording
on PC Hydra to look for three .FSY files rather than two. This should
allow for about 380MB total, and I hope we don't need to go bigger than
that.
- 12:30 UTC, Sunday, 2010 Jan 03, week 01. More snow, perhaps this time
due to snow falling from the house onto the antenna. It took longer to
recover from this outage - a recovery of well over 12 hours and not finished
as I write this. Signal
plots for the period.
- 07:00 UTC, Sunday, 2010 Jan 03, week 01. Rebooted PC Hydra after
security updates.
- 23:40 UTC, Saturday, 2010 Jan 02, week 01. Snow until about
01:30. Signal plots
for the period.
- 07:00-07:30 UTC, Saturday, 2009 Dec 12, week 50. TelliCast had
restarted on the main PC Feenix at 17:29 yesterday possibly due to a
combination of large files, so took the opportunity to update: removed old
ARSoft RAMdisk, installed recent Cenatek RAMDisk, set to 180MB, upped FSY
file entry to 188,400,000 bytes, installed 29 security updates, rebooted,
set Cenatek RAMdisk to use drive Z:, set drive Z: for sharing, restarted
TelliCast. As this is the PC driving the 22KHz band-switch signal for
the LNB is means that the other two PCs (Stamsund and Hydra) will have lost
signal for a minute or so. Noted that the CPU increased on Feenix
after the reboot - up from a 2-hour average of about 11% to 17%. Saw
something similar from late May to early June, so not concerned about it.
- 09:42 UTC, Tuesday, 2009 Dec 08, week 50. Trials started of MODIS L1
data on [Data Channel 4], with files up to 89MB, which caused the FSY files
on three systems to fill up (PC Hydra already had a full FSY file).
Asked EUMETSAT whether this data might be placed on its own channel so that
users of the hourly FSD data were not penalised. Screen-shot
of the steps.
- 17:00 UTC, 2009 Aug 28, installed Windows-7 on PC Hydra.
- 10:00 UTC, 2009 Aug 17, installed Windows-7 on PC Stamsund.
- 09:30 UTC, Friday, 2009 Aug 07, week 32. Noted that TelliCast again
lost connection to the Announcement channel. Replaced the 2.6D card in
Stamsund with an older 2.3 card, which was still recognised by the
drivers. Also changed the splitters so that the main PC was in sole DC
control of the main LNB feed.
- ~13:55, 16:10 and 18:15, Wednesday, 2009 Jul 01, week 27. Signal
strength dropouts due to heavy rain, causing missing data. The
45-second TelliCast error timeout was not triggered.
- ~14:50-17:40, Sunday, 2009 Jun 14, week 24. Signal
strength reductions due to local thunderstorm activity (ice crystals in
the clouds?) and heavy rain. The 45-second timeout for the TelliCast
error script was not triggered.
- 11:23 UTC, Saturday, 2009 Jun 13, week 24. Short EUMETCast outage
lasting about two minutes (11:23:40 - after 11:26:40). Rain and
thunderstorm. Another at 13:55:04 - after 13:58:49 UTC. All
three SkyStar cards and the Dexatek USB box lost lock. No action
needed to restore the signal. During the first break, I had enough
time to install pending security updates and during the second break just
enough time to reboot the main receiver PC, Feenix.
- 17:20 UTC, Thursday, 2009 May 21, week 21. Noticed that PC Feenix
spoke the time later than it should. Seemed to be something eating up
memory almost to the maximum of 2464MB, and then reset to normal. Saw
two TelliCast icons. Took the opportunity to install the security
updates and reboot. Nothing in the Application event log. System
event log for 18:19:14 had unexpected error on the RAMdisk, and this was
/before/ the installation of the security updates. Last reboot was
13-Mar-2009, so some 69 days.
- 01:00 UTC, Tuesday, 2009 Feb 24, week 09. EUMETCast Ku-band switched
from Eurobird-9 to Eurobird-9A. About two minutes net
interruption. There are quite a few reports of signal strength changes in the
MSG-1 self-help group,
from this
message onwards. Most are up in strength, with only those of us in bonny Scotland being
down! Many folk are delighted, and the transition does seem to have been very smooth.
Only one PC that I know of failed to re-connect to the new satellite.
- 06:42..06:50 UTC, Thursday, 2009 Feb 12, week 07. There was a short
EUMETCast Ku-band break just before 06:00, and a longer outage from 06:42 to
06:50. Reports of a higher signal strength once the data
returned. PCs Feenix and Stamsund were rebooted at 06:55 after
installing security updates, and PC Feenix was set to the retune method of
restarting. PC Hydra recovered its connection correctly, but PC Gemini
with the Dexatek card did not (communication seems to have been lost between
the Dexatek driver and the TelliCast software), and it was necessary to
restart both programs to restore operation. Unfortunately, I didn't
recognise this until about 11:30 UTC.
- 07:00 UTC, Friday, 2009 Jan 16, week 03. Restarted PC Hydra after a
security update, and TelliCast didn't restart correctly, nothing in the log
file, even with verbose logging. Found out (by running the V2.5.3 client)
that it didn't like comments after the section name in recv-channels.ini, so
"[DWDSAT] # data from DWD" is not
acceptable! Reverted to V2.4.4B client.
- 07:00 UTC, Monday, 2009 Jan 12, week 03. Upped the RAMdisk on Feenix
& Gemini to 127MB (max. possible, 150MB failed on Feenix, and gave only
127MB on Gemini). Was some disruption with the other EUMETCast PCs.
- 19:25 UTC, Tuesday, 2009 Jan 06, week 02. I observed a much higher than normal Missed Packets rate on TelliCast from
19:25 UTC yesterday on all PCs, lasting until about 20:15. There was a slight Ku-band signal strength reduction from 18:55, and
considerable reduction since 20:25. The reduction was seen across Europe,
to varying degrees, but was restore bat around 09:40 UTC on Wednesday.
We had noted that it was a particularly cold night around Darmstadt.
- 06:30 UTC, Monday, 2009 Jan 05,week 02. As the FSY files were
approaching the limit on both Feenix and Gemini, upped the RAMdisk to 150MB
(157,286,400 bytes) and edited recv-channels.ini accordingly. These
changes will only take place at the next reboot of each PC. Done for
Gemini.
- 21:22 UTC, Friday, 2009 Jan 02, week 01. The TelliCast tc-recv.exe
stopped working on Feenix, and appeared to have been restarted by the
watchdog on Gemini. Hydra and Narvik were unaffected. I didn't
notice Feenix until over an hour later, so I installed a set of pending
security updates and rebooted. Was then OK, except that the CPU 2-hour
average now seems to be nearer 10% than the 15% which has been over the last
month. Can't explain this, as the throughput is unchanged. No
other stations saw the same issue. The only common factor I can see is
that both Feenix and Gemini are on the first output of a splitter from the
LNB (but different feeds from the dual-LNB).
- 09:00 UTC, Wednesday, 2008 Dec 17, week 51. EUMETCast over Hotbird-6 was
due to be switched off today.
- 07:38 UTC, Sunday, 2008 Nov 16, week 46. PC Stamsund started to give
eToken-related errors (Failed to decode key, wrong interface address, etc.). Restarted at 1055 UTC. Noted that there had been
a few of this type of error before: a few every day up to Oct 29, then a few
every day from Nov 12 onwards. A simple restart didn't fix it (no licensed
data flowing), so cold reboot at 11:25. Now seems OK.
- 1000 UTC, Friday, 2008 Nov 14, week 46. PC Feenix replaced PC Hermes as
the main EUMETCast receiver. For continuity's sake, I carried over the
old MRTG data from Hermes. Removed the amplifier and splitter from
Hydra, so that should be restored to its exact previous configuration.
Data for the period Wednesday - Friday will be different (and lower, it
appears).
- 14:46 UTC, Wednesday, 2008 Nov 12, week 46. Added a 13-18dB amplifier
and a 4-way splitter to feed to the Test PC, Hydra. This to allow
build of a replacement PC for Hermes whose CPU fan is now very noisy, and
which is is showing disk errors.
- 11:00 UTC, Tuesday, 2008 Nov 11, week 46. Switched EUMETCast from
Hotbird-6 to Eurobird-9, seeing slightly improved signal and
SNR.
- 11:35 UTC, Wednesday, 2008 Nov 05, week 45. PC Stamsund
spontaneously rebooted. Nothing in the event log. As TelliCast
had been restarted, took the opportunity update the SkyStar database here as
well.
- 10:05 UTC, Wednesday, 2008 Nov 05, week 45. Updated PC Hydra with
the SkyStar HB6/EB9 database. Caused slight glitch in service when the
database was "Restored", and a further glitch when I ran TransEdit
just to check it worked.
- 07:30 UTC, Wednesday, 2008 Nov 05, week 45. Added SNR monitoring to
the main PC, Hermes, in anticipation of the change of satellite to
Eurobird-9 tomorrow.
- Saturday, 2008 Nov 01, week 44. Various tests: (a) to confirm
skew direction: when looking towards the satellite, satellites to the east
such as Astra (and Hotbird-6 and Eurobird-9 from Edinburgh) will appear
tilted anti-clockwise, and this is the direction to which the LNB should be
set when looking towards the satellite. The lead should come out at
the "5 o'clock" position rather than it's default position of
straight-down (6 o'clock). The final position should be tweaked
carefully for best quality. (b) found that I could receive Hotbird-6
in Edinburgh on a 35cm portable antenna with careful adjustment.
Changing a 0.6dB LNB for a 0.2dB unit resulted in an increase of signal
quality from 52% to 55%, while the signal strength remained unchanged ay 70%
(Dexatek DVB box and 32-bit drivers on Windows Vista). (c) to discover
that I could actually receive Eurobird-9 on 11977MHz using this new Silver
Tech Inverto 0.2dB LNB, although the alignment of azimuth, elevation and
skew was very critical to get a stable signal. Note that exactly what
0.2dB means is uncertain - an average value over the frequency and band
range, a best value, only at one optimum temperature etc. etc. The
same may apply to the 0.6dB figure as well! Caveat Emptor.
- 1630 UTC, Thursday, 2008 Oct 30, week 44. Upgraded the SkyStar
drivers to V4.5.0 on the backup PC (Stamsund) in an attempt to reduce the DPC
latency and error rate. Noted that the V4.4.1 drivers which work
fine on Hydra (XP SP2) refuse to load on Stamsund's XP SP3. However, the
SNR/Quality on the MRTG monitor were occasionally reported as zero (you do
need the newer 28,672-byte B2Status.exe), so I tried swapping the order of
the BER and SNR/Qual calls in the MRTG list. DPC
results.
- 0600 UTC, Wednesday, 2008 Sep 03, week 36. Turned off EARS-AVHRR on
the backup PC (Stamsund), as it's not processed there, and is already on at
least two other PCs.
- 1540 UTC, Tuesday, 2008 Aug 26, week 35. Arne suggested trying Zone
Alarm with 192.168.238.238/255.255.255.0 in the trusted zone, I restored ZA
on Hydra with that setting. However, any Zone Alarm activity
does increase missed packets, so decided to leave ZA disabled on that PC
(which is not used for routine interactive work).
- 1250 UTC, Monday, 2008 Aug 25, week 35. As an experiment, turned off
the Zone Alarm firewall on PC Hydra to see how much reduction there might be
in missed packets before FEC etc. Present values about 126
packets/hour lost, and 2 packets/hour recovered.
- Late Tuesday night, 2008 Aug 19, week 34. System HD on Hermes
failed, so rebuilt Hermes the next morning (Wed 20). Noted that the
CPU load and missed packets before FEC was quite a lot lower, as there was
no defrag, anti-virus or Firewall software installed. At 04:39 UTC on
the 21st,
installed mstDefrag software, and did notice an increase in the CPU used
from about 8% to about 12% (1GHz Pentium III). It had been about
16% average CPU before. Had been about 5 packets/hour missed
with all three running, now just 1 packet/hour or less.
- 1750 UTC, Saturday, 2008 Jul 19, week 29. The uplink of the
EUMETCast service suffered a brief rain outage, and whilst this didn't
trigger the automatic restart scripts, it did trigger a timing glitch on two
out of three PCs (Hermes and Stamsund).
- Wednesday, 2008 Jun 25. Added CMA data stream to main PC (Hermes)
and backup PC (Stamsund). It's about a GB per day.
- 2205-2245 UTC, Monday, 2008 Jun 02, week 23. Signal drop and loss
(22:10, 22:20 and 22:24 UTC) possibly due to bad weather at the Usingen uplink
station.
- 2106 UTC, Tuesday, 2008 May 13, week 20. Meteosat-9 safe mode
triggered, so Met-8 Rapid Scan suspended and main service reverted to MSG-1
(Meteosat-8). Normal service, including rapid-scan, restored Monday,
2008 May 19.
- 0900 UTC, Tuesday, 2008 May 13, week 20. Rapid Scan Service on
Meteosat-9 released to users.
- 1300 UTC, Tuesday, 2008 May 06, week 19. Rapid Scan Service on
Meteosat-9 released to manufacturers.
- 0800 UTC, Monday, 2008 May 05, week 19. Start of main MSG-2 data
processed to effective radiance and not spectral radiance. Parallel dissemination of
MSG-2 data processed to effective radiance ended.
- 0800 UTC, Tuesday, 2008 Apr 29, week 18. Parallel dissemination of
MSG-2 data processed to effective radiance started.
- Sunday, 2008 Mar 02, week 9. Noticed some files named: E6D02290000030400001.
These have an invalid file name, as 2006 did not have 28 days in month
02. Could be renamed to E8D02290000030400001 for correct processing.
- 1649-1723 UTC, Tuesday, 2008 Feb 26, week 9. EUMETCast signal loss
on PCs Gemini, Hermes, Hydra and Stamsund. The signal strength
indicator on Gemini stayed at 69%, but was red. When the antenna lead
was removed it dropped to zero. Normal operation has a yellow-green,
and not a red, background.
- 0919 UTC, Monday, 2008 Feb 25, week 9. Was informed by EUMETSAT that
they don't use PID 502, so removed it from the Vista PC (Gemini).
- 1550 UTC, Saturday, 2008 Feb 23, week 8. Noticed intermittent red
T-icons on Hermes when doing other work. The log file was full of
failures to connect to the DWDSAT channel, which is on PID 302. But
when comparing Hermes and Gemini, it was PID 502 which was missing from
Hermes, and that's not listed on the EUMETSAT web-site list. Perhaps
PID 302 got lost in the glitch on Feb 13? Looks as if the act of adding
PID 502 into Hermes (what data?) has also restored PID 302 to being active.
- 1357 UTC, Wednesday, 2008 Feb 13, week 7. EUMETCast glitch caused
restarts on Hermes, Hydra and Stamsund. Noted about 400MB/day less
throughput on Hermes compared to Gemini after that, and they were identical
before. Why?
- 0700 UTC, Friday, 2008 Feb 15, week 7. Power-off reset of
Stamsund. The SkyStar2 PCI card now reports a lower signal level by about 1.25dB.
"Stable 2" condition!
- 1100 UTC, Saturday, 2008 Jan 26, week 4. Had occasion to reboot
Stamsund and found the reported signal level jumped by 1.5dB and quality by
8%. The actual signal was completely unchanged (as reported by
Hydra). Now it's Hydra 7.3dB 58%, Stamsund 7.1dB 56%. So much for consumer-level products!
- 1230 UTC, Monday, 2007 Dec 31, week 53. Replaced SkyStar V2.3 card
in Stamsund with V2.6D card, both to reduce the heat and to provide more
meaningful signal comparisons.
- 1700 UTC, Tuesday, 2007 Dec 25, week 52. PC Stamsund (backup PC)
power-supply fan stopped working. New PSU purchased from Maplins on
Boxing Day (26th) and operation restored at 11:30 UTC.
- ~0815 UTC, Tuesday, 2007 Nov 27, week 48. TelliCast Web service on
Test PC Hydra seemed to stop working. Windows updates installed
(including MS IE 7) and PC rebooted at 0615 the next day.
- 1725 -1737 and 2012 -2034 UTC, Tuesday, 2007 Nov 13, week 46. power
outage.
- 1420 UTC, Wednesday, Nov 07, week 45. Step increase in signal
strength and quality across Europe. About 1dB in signal strength and
5% in quality.
- 1610 UTC, Tuesday, Nov 06, week 45. Possible small step drop in signal
strength. 05 - 1.0dB, and slight quality reduction. Seen across Europe.
- 1415-1640 UTC, Tuesday, Nov 06, week 45. Although the signal
strength remained steady at its reduced level, the backup PC Stamsund showed
a very high missed packet/recovered packet rate, and hung at 1640. Is
the card on its way out?
- 0721 UTC, Monday, Oct 29, week 44. eToken error on Stamsund (backup
PC). Could not restart as the Web server port wasn't released (and so
still in use). Logged out and back in to restart OK at 18:00.
ERR:2007-10-29 07:21:43.212:eToken transaction timed out
ERR:2007-10-29 07:21:43.212:Critical dongle error (eToken transaction timed out). Restarting child.
ERR:2007-10-29 07:21:43.337:EToken thread does not terminate
- 0340 UTC, Sunday, Oct 28, week 43. Sharp dip in signal strength seen
on backup and test PCs, with degradation on either side of that time.
There was high wind here overnight, and perhaps rain. Nothing seen
across the rest of Europe. Slight data loss on the Backup PC
(Stamsund, V2.3 card) but nothing on the others (V2.6 cards).
- 2345 UTC, Monday, Oct 22, week 43. Break in EUMETCast from
2345-2359, and 0029-0042 (Tuesday 23). On Hermes and Hydra, the
timekeeping suffered a glitch as well.
- 0137 UTC, Saturday, 2007 Oct 20, week 42. Breaks in EUMETCast at
01:37:49 - 02:39:49 (Hermes), 01:37:54 (Hydra), and 01:38:00-02:39:49 on
Stamsund. On Hydra, the PC rebooted (with nothing in the event log), and on Stamsund, Server4PC.exe
"encountered an error". It looks as if the signal now is at
reduced strength and therefore reduced quality. However, Europe-wide
the strength and quality look OK. Rebooted Hydra again to try and
restore the correct signal strength reading.
- Tuesday, 2007 October 16, week 42. More uplink events. Signal
breaks at: 13:39:44 UTC and 13:44:10 (Hermes), 13:39:44 and 13:44:10
(Hydra), and 13:39:45 and 13:44:10 (Stamsund). BER and SNR look to be
back to normal after that.
- 1130 UTC Monday, 2007 Oct 15, week 42. T-Systems switched the entire Ku-band uplink to a redundant antenna.
The BER went down to almost nominal levels, and the signal level returned
gradually to near normal over the next few hours (some "noise" on
the SNR graph from Stamsund until about 18:00). The switch resulted in
small breaks being reported: on Hermes and Hydra at: at 11:31:03 UTC,
so the break at 11:30:33 (30-second TelliCast LOS timeout). Remarkably, no data was lost as a direct
result.
- 1300 UTC, Friday, Oct 12, week 41. Large signal strength drop noted
by V2.6 cards throughout Europe. Two short periods of normal strength
at around 1900-1940 on Friday 11th and around 0430-0530 on Saturday 12th.
- Afternoon, Thursday, 2007 Oct 11, week 41. The BER observed on the
backup PC started to increase, and had reached a sustained level of about
10^-3 (one in a thousand) by about 0200 on Saturday, Oct 13. I believe
this higher BER to be due to interfering signals from the satellite, but
that the lower signal strength reported above makes the effect of this interference
far worse.
- 1845 UTC, Sunday, 2007 Aug 19, week 33. EUMETCast strength glitch
seen throughout Europe - probably weather-related. Triggered a restart
on my older V2.3 card PC. There was a BER spike at 0545 UTC on Aug 19,
and an increased BER level from 1030 UTC onwards until 1030 UTC on August
20.
- 1100 UTC, Wednesday, Aug 08, week 32. A sudden increase in signal
level noted on SkyStar V2.6 cards across Europe, and a drop in BER to zero
on my own SkyStar V2.3 card. Something changed at the uplink or on the
Hotbird-6 satellite. What?
- 1600 UTC, Monday, Aug 06, week 32. The higher BER noted on Saturday
Aug 04 seems to have reverted to its previous level. See: comparison
for the current graphs. Later: I heard from EUMETSAT that they found a performance problem in the Channel "EUMETSAT Data Channel
2", which also caused longer than usual delays on channel 2 and some other
channels. The problem was corrected yesterday around 16:30. No parameter change, just a reset of the server application.
- Saturday, Aug 04, week 31. At about 0230 UTC the missed packets and, perhaps,
the recovered packets, seems to become somewhat worse on the test PC
Hydra. This co-incided with the return of the IASI data. The
IASI files appear to be about the same size, though, so I would not expect
an increase. The same effect
was seen on the main PC from about 0330 UTC, although it does not take the IASI data (but it
does take Metop AVHRR data). See: comparison
for the actual graphs.
- 2006 UTC, Tuesday, Jul 31, week 31. TelliCast on Hermes
stopped. eToken transaction timed out. Event Viewer showed
"Smart Card Reader 'AKS ifdh 0' rejected IOCTL 0x310014: The semaphore
timeout period has expired." 2140 UTC logged out and
back in to Hermes, seemed to restart TelliCast OK. This stopped some
of the MRTG collection for a period.
- 1146-1149 UTC, Friday, Jul 20, week 29, EUMETCast drop-out triggered
TelliCast restarts on all three PCs. Drop-out was slightly longer on
the older V2.3 card on Stamsund, 1144-1150 UTC. NTP transients
triggered on Hermes and Hydra.
- 1811-1813 UTC, Tuesday, Jul 10, week 28. EUMETCast drop-out
triggered restart on Stamsund. Other PCs handled the loss OK.
- 1430 UTC, Friday. Jun 29, week 26. Seems that Hermes may not have
properly recovered after the Jun 21 crash, as the T-icon was intermittently
turning red, there were error messages about joining the DWDSAT channel, and
there was less DWDSAT data than expected (only about 100MB/day instead of
750MB/day). Couldn't stop and restart the TelliCast client (Web server
address not released), so rebooted Hermes. DWDSAT PID may have been
lost across the restart.
- 0900 UTC, Wednesday, Jun 27, week, 26. MSG-1 Rapid Scan data
restarted.
- 0900 UTC, Monday, Jun 25, week 26. MSG-1 Rapid Scan data stopped.
- 0317-0325 UTC, 1141-1146 UTC, Thursday, Jun 21, week 25. Rain-storms at Darmstadt
caused EUMETCast signal outage.
- 0915-0950 UTC, Wednesday, Jun 20, week 25. TelliCast fell over on
Hermes with an: "eToken transaction timed out, Critical dongle error
(eToken transaction timed out). Restarting child, EToken thread does not
terminate. So took the opportunity to install all the Microsoft Update
patches and update the anti-virus software to a new version.
- 1517-1524 UTC, Thursday, Jun 14, week 24. Rain-storm at Darmstadt
caused EUMETCast signal outage.
- 1400 UTC, Wednesday, Jun 13, week 24. MSG-1 rapid-scan data halted (seen on
Backup PC Stamsund).
- 1304 UTC, Wednesday, Jun 13, week 24. IASI data halted (seen on Test PC
Hydra).
- 1659-1703, 1708-1711, 1723-1735 UTC, Sunday, Jun 10, week 23.
Rain-storm at Darmstadt
caused EUMETCast signal outages.
- 1317-1335 UTC, Saturday, Jun 09, week 23. Rain-storm at Darmstadt
caused EUMETCast signal outage.
- 0615-0745 UTC, Tuesday, Jun 05, week 23. Power glitch at Darmstadt
took out everything except DWDSAT.
- 0955 UTC, Friday, Jun 01, week 22. MSG-1 rapid-scan data started
(seen on Backup PC Stamsund).
- 1926 UTC, Saturday, May 26, week 21. Signal outage/dropout 1925-1935
caused repeated restarts on Stamsund, two separate restarts on Hydra (at
1926 and 1929), and no effect on Hermes. Note that Hermes is fed via a
single splitter, and Hydra and Stamsund via two splitters and so will have a
lower signal strength.
- 0015 UTC, Saturday, May 26, week 21. Signal outage/dropout 0014-0019
caused restarts on all three PCs.
- 1300 UTC, Thursday, May 24, week 21. IASI data added to Test
PC. Increased data throughput, of course, plus increased missed data
packets and recovered data packets.
- 1000 UTC, Thursday, May 10, week 19. MSG-1 data dissemination halted.
- 1900 UTC, Tuesday, 2007 May 01, week 18. Considerable disruption to
EUMETCast services causing reduced data volumes and hence reduced missed FEC
data.
- 2007 Apr 11. MSG-2 replaced MSG-1 as the primary satellite.
- ~1240 UTC, Thursday, 2007 Feb 08, week 6. About 2dB dip in SNR lasting abut 30 minutes, centred on
1240.
- ~0930 UTC, Wednesday, 2007 Feb 07, week 6. SNR dip of about 1.5dB, worst at 0930, visible from about 0700 - 1400.
- ~2235 UTC, Sunday, 2007 Feb 04, week 5. TelliCast fell over on
Stamsund, taking the TelliCast logging (and hence MRTG) down on Narvik.
- 0820 UTC, Thursday, 2007 Feb 01, week 5. There was another glitch which caused a timekeeping step on the Test PC, and required an NTP restart on the main PC.
This seemed to coincide with a slight increase in signal quality and SNR as
recorded by the Test PC (0.5dB SNR and 2-3% quality).
- 07:50 UTC, Thursday, 2007 Feb 01, week 5. Test PC (Hydra) lost
EUMETCast connection for more than 90 seconds.
- 0424 UTC, Friday, 2007 Jan 19, week 3. EUMETCast drop-out triggered
restart event on Hermes. Hydra timekeeping affected.
- 1750-1820 UTC, Thursday, 2007 Jan 18, week 3. EUMETCast drop-out
on all three PCs. 19 red Server4PC icons visible on Stamsund 20 on Hydra..
- 0415 UTC, Monday, 2007 Jan 01, week 1. Sudden and deep drop of
EUMETCast signal strength all over Europe. Automated restart not
triggered (90s signal timeout).
- ~1520-1525 UTC, Sunday, 2006 Dec 31, week 52. PC Hydra time was
off, due to a drop in signal strength. Heavy rain and hail.
Suspect the card must have come near to loss of signal. but not quite.
The 90-second LoS TelliCast timeout was not triggered. Hermes
timekeeping also off. Restarted NTP on Hydra & Hermes.
- 0200 UTC, Friday, 2006 Dec 15, week 50. EUMETCast seemed to drop
out on Hermes and Hydra, but OK on Stamsund (older V2.3 card).
Required a manual restart on those two PCs. NTP consequently
affected.
Two more drops at 20:47 and 21:53, handled by automatic restart on
Hydra. Hermes didn't have automatic recovery and didn't re-lock, so
some data loss. Stamsund (V2.3 card) unaffected. Added automatic
restart to Hermes and Stamsund.
- 0200 UTC, Wednesday, 2006 Dec 13, week 50. EUMETCast seemed to drop
out on Hermes and Hydra, but OK on Stamsund (older V2.3 card). Hydra
also showed a drop from 10:00 to 11:00 (from about 9dB to 7.5dB). NTP
also affected.
- 1810 UTC, Sunday, 2006 Dec 03, week 48. Upped FSY file on Hermes to
RAMdisk 95MB, FSY size 99,000,000. Not tested with a reboot.
Later restored to 80MB, 83000000 for safety, that's what's working right
now, so leave it!
- ~22:30 UTC, 2006 Nov 29, Wednesday, week 48. Glitch on EUMETCast
caused PC Hermes and Hydra to stop collecting. Needed to restart by
selecting EUMETCast in Setup4PC. Stamsund (V2.3 card) recovered by
itself.
- 2345 UTC, 2006 Nov 28, Tuesday, week 48. Altered EUMETCast on
Hermes (a) to make the FSY file bigger (have 80MB RAMdisk allocated but file
size limit was 60,000,000 bytes) and (b) to specify a
tmp_directory=temp in the [parameters] section of the recv.ini file. I
noticed that the 28MB EPS global AVHRR files could take anything up to 30
seconds to build up.
- 0155 UTC,2006 Nov 27, Monday, week 48. Glitch on EUMETCast stopped
Hydra and Hermes reception. Hermes (V2.6D card) responded to a
right-click, select EUMETCast, but I decided to reboot Hydra as it was in
need of Windows XP security updates in any case.
- 1200 UTC, 2006 Nov 23, Thursday, week 47. Added BER/SNR/Quality
reporting on Hydra.
- 1043 UTC, 2006 Nov 22, Wednesday, week 47. Glitch on EUMETCast (?)
stopped Hydra working, but Hermes and Stamsund carried on. Some
segment loss on the 1030 HRIT.
- 0936 UTC, 2006 Nov 22, Wednesday, week 47. Added DWDSAT to Hermes.
- 0130 UTC, 2006 Nov19, Sunday, week 46. Timekeeping glitch on Hydra
suggests EUMETCast transient.
- 1440 UTC, 2006 Nov 17, Friday, week 46. Stamsund rebooted after
security updates.
- 1210 UTC, 2006 Nov 16, Thursday, week 46. Stamsund showed a period
of non-zero BER between two SNR glitches (12:10 and 13:40 UTC).
- 0700 UTC, 2006 Nov 08, Wednesday, week 45. Hydra rebooted to pick
up pending security updates.
- 2010 UTC, 2006 Nov 07, Tuesday, week 45. Missing segments on PCs
Hermes and Stamsund, and red satellite icon on Hydra. Could restart
satellite reception by right-clicking the Server4PC icon and selecting
"EUMETCast Hotbird 13E".
- 0140 UTC, 2006 Nov 02, Thursday, week 44. Seemed to be a
timekeeping glitch on both Hydra and Hermes, so I suspect a EUMETCast glitch
around this time. Another glitch at about 06:05.
- 1145 UTC, 2006 Oct 26, Thursday, week 43. BER on PC Stamsund
dropped back to zero. Nothing was changed at this end. Something
on the satellite or uplink? From about 16:00 UTC the SNR became
slightly higher. but slightly more variable, and there were some
corresponding slight increases in signal quality as well. Will need to
watch this carefully in case it's a developing fault this end. Just
realised that it was quite windy on Thursday afternoon. A
co-incidence?
- 0015 (clock), 2006 Oct 24, Tuesday, week 43. PC Stamsund recorded
very high peaks just after midnight local time. Some missing segments,
but only on Stamsund. Recorded BER (MRTG entries average/maximum for period
2315 UTC 33593/35865, 23:20 UTC 2503/35865, 23:25 UTC: 24/248). As
the signal strength remained normal, I can't explain the very high BER
(except perhaps by very high CPU load). TelliCast FSY file stayed the
same size (16.037MB). Nothing in the event
log. No missing MSG-2 data. MSG-1 missing 2315, ch. 1..11 seg 2,
ch. 12 seg 6 & 7. Raw data edited from MRTG log file: 1161645900 0 24 0 248,
1161645600 0 2503 0 35865, 1161645300 0 33593 0 35865. Left some
trailing BER values. This at least allows the rest of the more subtle
BER to be seen! Later - Arne van Belle reported a drastic drop in
signal at the same time, although no BER. So I restored the edited
entries to the MRTG plot, but with the values limited to 100.
- 1000 (clock), 2006 Oct 10, Tuesday week 41. EUMETCast reverted to
normal MSG-1 and MSG-2 operation, so the backup PC should show approximately
twice the throughput.
- 0910, 2006 Oct 10, Tuesday week 41. Stamsund spontaneously reboot
during a period of high network activity, so there is a small outage shown.
- 0500 - 0630, 2006 Oct 04, Wednesday, week 40. Local power
cut. On restoration of PCs, all were showing red (no signal), until I
unplugged the LNB form the splitter for a few seconds. Hermes now
showing lower strength than before (59%, 7.3dB) but figures recorded on
Stamsund seem OK.
- 0950, 2006 Oct 02, Monday, week 40. LNB re-adjusted (using the
second output via an extension cable). Reading on Stamsund 64% 8.5dB,
reading on Hermes now 8.8-9.1dB 66-68%.
- 1150, 2006 Sep 26, Tuesday, week 39. LNB connections taped, but he
knocked the LNB (?). Reading down on Stamsund from 8.8dB 66% to 7.6dB
61%. (Also readings on Hermes down from 8.8-9.0dB 66% to 7.5dB 60%.)
- 1030 - 1200, 2006 Sep 25, Monday, week 39. Reception interruption
due to antenna mounting, LNB and snow-shield upgrades. Some heavy rain
in the afternoon as well!
- 1145 - 1545, 2006 Sep 21, Thursday, week 38. Reception interruptions
due to people working near the antenna.
- 1023, 2006 Sep 18, Monday, week 38. Added DWDGDS to test PC
(Hydra). Don't know what the daily data throughput is expected to be.
- 1030, 2006 Sep 16, Saturday, week 37. Added GEONETCast (Americas-CH1)
to backup PC (Stamsund). As there were some large files (almost 32MB)
the FSY file increased from 16MB to 49MB.
- 1735, 2006 Sep 13, Wednesday, week 37. Backup PC and BER collection
(Stamsund) rebooted. Noted that XP was trying to run System Restore on
Z: (but failing), so need to add the registry entries to prevent this.
- ~0600 UTC, 2006 Sep 13, Wednesday, week 37. BER suddenly went to
zero (as measured on the backup PC), thus possibly ending the problem which
began on August 25.
- 1404, 2006 Sep 12, Tuesday, week 37. Noticed a momentary, red
TelliCast icon on the main PC (Hermes). Network ID now showing when
tested on the backup PC (Stamsund). Still non-zero BER on backup PC.
- 0715, 2006 Aug 26, Saturday, week 34. Rebooted test PC, and the
reported signal level increased to 54% and 6.8dB. There was no actual
change, though, so the indication is plain wrong. 07:30 rebooted
Stamsund to see if this non-zero BER would go away. It didn't.
- 0830-0856, 2006 Aug 25, Friday, week 34. Hotbird-6 signal
loss. Both Stamsund and Hermes NTP became confused while the red
satellite icon was showing. Installed the security updates on Stamsund
and Hydra, and rebooted both. Last good file was time stamped 07:30:38
and first good file 07:56:45. Noted a non-zero BER on Stamsund after
the event, and the signal level was reported as low on Hydra (40%, 4.4dB),
dipping into the yellow.
- 0030-0300, 2006 Aug 13, Sunday, week 32. Data loss due to power
cut.
- 1000-1900, 2006 Aug 07, Monday, week 32. PC Stamsund rebuilt with Windows XP
Pro.
- 1456-1522, 2006 Aug 03, Thursday, week 31. PC Stamsund was down
for maintenance. Memory upgraded from 1 to 3GB, and thoroughly
cleaned! The SNR and BER figures will plot as constant during the
outage, which is not unreasonable.
- 2006 Jul 23, Sunday, week 29. Three brief dropouts during the period
19:00 - 20:30 UTC. Bad weather at the Usingen uplink station may have
been the cause.
- 2006 Jul 09, Sunday, week 27. Today showed the maximum throughput of
EPS test data (graph
here). During the 24 hours up to 0600 UTC Sunday morning, the
measured throughput on the DVB (as found on the TelliCast Statistics page)
was 38.7GB, and 40.0 GB of EPS data files were received. There was
also 11.0GB of Data Channel 1/2/3 etc. data throughput, so the total data
received must have been at least 51GB (40.0+11.0). As the TelliCast
system can include data compression, this may account for more data being
received (51GB) than the throughput shows (38.7GB).
The maximum 1-day average as shown by MRTG was 502kB/s, which is 41.3
GB/day, and this would have been the throughput for Sunday, July 09.
During Sunday (UTC+1), 38.4GB of EPS data files were received, so the actual
data received (49.4GB) again exceeds the throughput (41.3GB). Because
of the averaging in MRTG, it's possible that the actual 1-day value was
higher, so this may be a little misleading.
- 1600, 2006 Jul 05, Wednesday, week 27. Rain prior to a thunderstorm
caused a signal drop-out between about 1500 and 1530 UTC, and messed up NTP
timekeeping on Hermes and Hydra.
Stamsund was OK. All PCs retained signal lock without any
intervention.
- 2006 July 03, Monday week 27. Saw one peak on the EPS test PC of
average 5 minute rate 911.2kB/s, and a TelliCast HTML Shell peak of
20.3Mb/s. Maximum 5-minute peak on Tuesday was 988.5kB/s.
- 2006 Jul 02, Sunday, week 26. Some short, sharp thunderstorms this
morning produced signal drops and BER increases, but no missing segments.
However, a storm at 1500 clock resulted in a signal loss from about 14:45
to 1458, with the indicator in the red. Gradual recovery from 1500
clock onwards. Took the opportunity to apply security updates to
Stamsund.
- 0800 clock, 2006 Jun 30, Friday, week 26. High rate data tests
today - so far highest seen is 10.6Mb/s (from TelliCast shell overview).
- 1630 clock, 2006 Jun 29, Thursday, week 26. Since 1800 clock
yesterday, the test PC hasn't missed a single LRIT or HRIT segment, just one
DCP/WMO message. Looks as if the USB box is coping OK, as EPS/AVHRR
data has been flowing. But there have been some EPS/AVHRR files
noticeable smaller than most, so perhaps it is the EPS/AVHRR data which is
suffering? Closer inspection showed that all files received were the
same size as those on Arne van Belle's system, but that for the first couple
of hours after starting yesterday, some of the AVHRR files were simply
missing. From 1542 to 1745 UTC, June 28, Arne's system saw 45
EPS/AVHRR files, the USB system saw only 32 files. All but one of the
missing files was before I restricted the data to just channel EPS-10, so probably
caused simply by data overload.. Restored test PC to PCI card and full EPS data flow.
- 1800 clock, 2006 Jun 28, Wednesday, week 26. When AVHRR EPS data
started flowing, missing segments started to appear (mostly but not entirely
in the faster HRIT data), so I commented out all EPS channels except
the AVHRR data (EPS-10), to see how well the system could them cope.
This simulates the load from a user taking MSG-1, AVHRR regional from
NOAA-17/18 and AVHRR global from METOP.
- 1030 - 1100 clock, 2006 Jun 28, Wednesday, week 26. Removed DVB PCI
card from Hydra (the test PC) and replaced with older USB box from John
Tellick. Needed to add USB driver, and force correct IP address.
This is to test if the USB box (and its 12Mb/s maximum connection) can handle the
data from EPS as well as the normal MSG-1 and AVHRR data, without disruption
of MSG-1 and AVHRR reception. The peak rate seen so far through the
USB box has been 7.2Mb/s, monitored on the TelliCast HTML shell, and no
missing segments. Later data rate peaks of up 9.8Mb/s did result in
missing segments, though.
- 1800 & 2300 UTC, 2006 Jun 25, Sunday, week 25. Thunderstorms in
Germany cause signal outage. PCs automatically recovered (although NTP
timekeeping was affected).
- 2200, 2006 Jun 18, Sunday, week 24. Some sort of TelliCast glitch again.
A few missing segments. Upset NTP timekeeping on both Hermes and Hydra.
- ~1100, 2006 Jun 17, Saturday, week 24. Signal loss and
re-acquisition on Hermes.
- 2000-2400, 2006 May 27, Saturday, week 21. Backup PC rebooted a
couple of times to convert C: from FAT to NTFS.
- 2006 May 19 - 2006 May 22, Friday - Monday, week 20-21. Data collection
stopped due to main PC lockup. Data from backup PC was substituted.
-
1000 clock, 2006 May 13, Saturday, week 19. Added splitter in the feed to
Stamsund so that it is now at least 6dB down on full signal. Very
difficult to discern any change in quality or SNR. 3rd feed now available
for a test PC (Hydra) with SkyStar V2.6D. Hydra statistics started Monday May 15, but will be
intermittent.
-
0941 clock, 2006 May 13, Saturday, week 19. EUMETCast down from 0841 -
0908
UTC.
-
0700 clock, 2006 May 12, Friday, week 19. PC Stamsund rebooted for security
update.
-
1800 clock, 2006 May 02, Tuesday, week 17. Updated TelliCast client on Stamsund to
V2.4.4 B.
I use MRTG to
monitor my networks on Windows 2000, XP, Vista and Windows-7 (32- and 64-bit). I suggest that you first set up MRTG to show the network
throughput on your system, using the instructions on the MRTG Web pages.
If you are using Windows Vista or Windows-7 you may first need to install
and enable the Windows SNMP component. Define
a directory for the output HTML and PNG files from MRTG, and use the command
"perl cfgmaker public@<pc-name>" to establish your basic MRTG
configuration file. Note also
that you will need to create the LogDir, HtmlDir and ImageDir folders yourself -
MRTG doesn't do it for you. These directories are where the summary log
files, the HTML output, and the PNG image output are stored. The HTML and
PNG output make up the graph pages you have seen above. You can use MRTG
for monitoring other information such as CPU load, disk usage, air
temperature and even cable modem signal levels.
To show throughput, SNMP (Simple Network Management Protocol) also needs to installed on the PC as part of the
Windows Networking components (it's on the Windows CD). To install SNMP,
Control Panel, Add/Remove Programs, Add/Remove Windows Components, check that
Management and Monitoring Tools are selected. Note that on Windows-7 and Vista, where the security is a little tighter, you may
need to add the "public" to the Services, SNMP, Properties, Traps
communities, and add "public" with READ ONLY access to the Security
settings. My thanks to Andrew Hall for reminding me about this possibility.
Andrew runs MRTG as a service, I run it from a shortcut in the Startup folder.
You can use SNMP/MRTG to monitor the throughput from the DVB card as well,
since it appears as a network device. Just as you determined the address(s)
for the PC's network, run PERL CFGMAKER again to find out the network device
interface number. Hint: I find ROUTE PRINT a much easier way, at least to
confirm the interface number. As the DVB card is a one-way device, you may
like to add the "noo" option to the DVB target in your MRTG
configuration script. Here's what I have for my PC Gemini:
Options[Gemini_DVB]: unknaszero, growright, noo
You can also use MRTG to plot a variable which can be
obtained from the command-line by running a program which writes it results to
"standard output", i.e. a normal command-line output. I used the
B2status.exe program from the B2C2 SDK which can return a snapshot of the status
of the DVB card. Please be aware that the version of B2status.exe in some SDK
versions does not work, so there are earlier and later copies here in B2satus.zip.
Please use the version appropriate for your drivers - the V4.4.1 version also
works with V4.5.1 (and, I hope, 4.6.0) software. You will need to copy this program
to the MRTG "bin" directory, so that the MRTG script can find it.
The B2status.exe program can take command-line parameters to limit
the displayed data, so I run this with the -TI parameter. The first line
of the Perl script below invokes the command, and processes the output from the
program into a four-line response as required by MRTG. There are three separate scripts - one to get the Quality and SNR,
one to get the BER, and one to get the "Strength" for drivers V4.4.1
and later. To make the values sensible integers for MRTG to plot, the SNR is
scaled by 10 so that both it and Quality become values in the range 0..120 (at
least on my system), and the BER is scaled by 1E6 so that it becomes an integer
"parts per million" value.
Note: it appears that using such small integers with MRTG may lead to slight
errors in the yearly and monthly plots, with the values being less than the true
values, so be careful not to interpret the results too critically. It
would perhaps be better to multiply the results by (say) 1000 before giving them
to MRTG, but you would then need to rescale the graphs and display text.
Allan Gibbs comments: When using b2status I had to add the card's
name - I just used "skystar" and it worked whereas I kept getting an error otherwise.
So my entry in the .pl files is:
b2status -a skystar -ti
Note for SkyStar V4.4.1 drivers: The first line would be:
$ntp_str = `"C:\\Program Files\\TechniSat DVB\\bin\\b2status.exe" -ti`;
if you needed to run the b2status command from its installed folder, for
example if you have the SkyStar V4.4.1 drivers.
File: SkyStarQualSNR.pl
$ntp_str = `b2status -ti`;
$qual = (split(/\n/,$ntp_str))[4];
$qual = (split(/ +/,$qual))[4];
$snr = (split(/\n/,$ntp_str))[5];
$snr = 10 * (split(/ +/,$snr))[3];
$snr = int ($snr);
print "$qual\n";
print "$snr\n";
print "0\n";
print "0\n";
I found that on one system, the SNR value reported was occasionally 1 or even
blank, I don't know why, so I made an experimental version in July 2009 which
has a retry should the SNR value possibly be incorrect. I called this
version SkyStarQualSNR-2.pl - here it is;
File: SkyStarQualSNR-2.pl
$ntp_str = `b2status -ti`;
$qual = (split(/\n/,$ntp_str))[4];
$qual = (split(/ +/,$qual))[4];
$snr = (split(/\n/,$ntp_str))[5];
$snr = 10 * (split(/ +/,$snr))[3];
$snr = int ($snr);
$ber = (split(/\n/,$ntp_str))[6];
$ber = (split(/ +/,$ber))[3];
if ($snr < 10) {
  $ntp_str = `b2status -ti`;
  $qual = (split(/\n/,$ntp_str))[4];
  $qual = (split(/ +/,$qual))[4];
  $snr = (split(/\n/,$ntp_str))[5];
  $snr = 10 * (split(/ +/,$snr))[3];
  $snr = int ($snr);
  $ber = (split(/\n/,$ntp_str))[6];
  $ber = (split(/ +/,$ber))[3];
}
print "$qual\n";
print "$snr\n";
print "0\n";
print "0\n";
File: SkyStarBER.pl
$ntp_str = `b2status -ti`;
$ber = (split(/\n/,$ntp_str))[6];
$ber = (split(/ +/,$ber))[3];
$ber = int (1000000 * $ber);
print "0\n";
print "$ber\n";
print "0\n";
print "0\n";
File: SkyStarStrength.pl
$ntp_str = `b2status -ti`;
$strength = (split(/\n/,$ntp_str))[3];
$strength = (split(/ +/,$strength))[4];
print "0\n";
print "$strength\n";
print "0\n";
print "0\n";
Once the values are available as integers, they can be plotted with
MRTG. Plotting the Quality and SNR requires a fixed 0..120 scale (allowing
for up to 12dB).
Plotting the BER is best done on a log scale, and strength a linear scale of
0..100%. I did add the Timezone
option, to make sure the plots are in UTC (which may be called GMT by MRTG) so that
plots from different countries may be more easily compared, and I added an
XSize setting so that the graphs cover a slightly wide time range. These
are entered as "default" values, i.e. using just the underscore as the
target name. I'm no expert in MRTG,
so if you have any suggestions for improvements of the following I would welcome
them!
Extra lines for MRTG.cfg
# These are default values. The XSize sets the graph width with
# the image being 100 pixels larger at 600 pixels.
# The TimeStrPos and TimeStrFmt put the date in upper-right corner.
# The timeout option provides extra delay when calling external programs.
XSize[_]: 500
Timezone[_]: UTC
TimeStrPos[_]: RU
TimeStrFmt[_]: %Y-%b-%d
SnmpOptions: timeout => 6
#---------------------------------------------------------------
# PC Stamsund - EUMETCast BER (bit error rate)
#---------------------------------------------------------------
Target[SkyStar_Stamsund_BER]: `perl SkyStarBER.pl`
MaxBytes[SkyStar_Stamsund_BER]: 1000000
Title[SkyStar_Stamsund_BER]: SkyStar V2.6D DVB PCI card on Stamsund
Options[SkyStar_Stamsund_BER]: gauge, nopercent, growright, logscale, withzeroes, unknaszero
YLegend[SkyStar_Stamsund_BER]: BER ppm
ShortLegend[SkyStar_Stamsund_BER]: ppm
LegendI[SkyStar_Stamsund_BER]:
LegendO[SkyStar_Stamsund_BER]: BER:
Legend1[SkyStar_Stamsund_BER]:
Legend2[SkyStar_Stamsund_BER]: Bit Error Rate (BER) in parts per million
PageTop[SkyStar_Stamsund_BER]: <H1>SkyStar2 V2.6D Bit Error Rate (BER) snapshots - Stamsund, Edinburgh</H1>
#---------------------------------------------------------------
# PC Stamsund - EUMETCast quality and SNR
#---------------------------------------------------------------
Target[SkyStar_Stamsund_SNR]: `perl SkyStarQualSNR.pl`
MaxBytes[SkyStar_Stamsund_SNR]: 120
MaxBytes2[SkyStar_Stamsund_SNR]: 120
Unscaled[SkyStar_Stamsund_SNR]: dwmy
Title[SkyStar_Stamsund_SNR]: SkyStar V2.6D DVB PCI card on Stamsund
Options[SkyStar_Stamsund_SNR]: integer, gauge, nopercent, growright
YLegend[SkyStar_Stamsund_SNR]: Quality, SNR x10
ShortLegend[SkyStar_Stamsund_SNR]: .
LegendI[SkyStar_Stamsund_SNR]: Quality %:
LegendO[SkyStar_Stamsund_SNR]: 10 * SNR dB:
Legend1[SkyStar_Stamsund_SNR]: Signal Quality (0..120%)
Legend2[SkyStar_Stamsund_SNR]: SNR * 10 (0..12.0dB)
PageTop[SkyStar_Stamsund_SNR]: <H1>SkyStar2 V2.6D Quality & SNR snapshots - Stamsund, Edinburgh</H1>
#---------------------------------------------------------------
# PC Stamsund - EUMETCast Strength
#---------------------------------------------------------------
Target[SkyStar_Stamsund_Strength]: `perl SkyStarStrength.pl`
MaxBytes[SkyStar_Stamsund_Strength]: 100
MaxBytes2[SkyStar_Stamsund_Strength]: 100
Title[SkyStar_Stamsund_Strength]: SkyStar2 V2.6D DVB PCI card on Stamsund, Edinburgh
Options[SkyStar_Stamsund_Strength]: integer, gauge, nopercent, growright
YLegend[SkyStar_Stamsund_Strength]: Strength %
ShortLegend[SkyStar_Stamsund_Strength]: %
LegendI[SkyStar_Stamsund_Strength]:
LegendO[SkyStar_Stamsund_Strength]: Strength:
Legend1[SkyStar_Stamsund_Strength]:
Legend2[SkyStar_Stamsund_Strength]: Strength (percent)
PageTop[SkyStar_Stamsund_Strength]: <H1>SkyStar2 V2.6D Strength snapshots - Stamsund, Edinburgh</H1>
#---------------------------------------------------------------
When I moved PC Stamsund to the drivers V4.5.0 (for lower DPC latency, V4.4.1
don't install on XP SP3), I noted that sometimes the Perl/B2status command
returned a blank result, and as I had the "unknaszero" option set,
these made for spikes showing zero signal on the graphs every so often, even
though the signal quality and SNR were fine. I therefore removed the
"unknaszero" option (although it will make down-time less
obvious). So far, the strength plots seem useless - with the backup PC
Stamsund stuck on 38% (V4.5.0 drivers), and the test PC Hydra dropping from 40%
to 25% for no apparent reason (V4.4.1)!
Daniel R. Hurtmans has been using similar tools under Linux to plot values
for his system in Brussels. During e-mail exchanges in October 2012 he
noted the following:
Methodology
I had to switch from MRTG to RRDTOOL. This was not an easy decision as transition is
not that easy, but it offers some features which are useful (handling properly missing data, having negative values, properly handling date/time conflicts).
Although it comes from the same developer and despite all my efforts to be as close as possible to MRTG look, resulting plots have a quite different look
and feel (I've still some work do polish-up the presentation, as I'm discovering the tool).
Reported values
About the SNR, the tool used to "measure" is called femon. It reports either pure hexadecimal, or percents (actually the hex value /0xffff).
I'll dig a bit to see if it is real or not. There are some discussions on the net about some card having a maximum of
30 dB so that the
percentage should apply to this value. I've no idea so far on the maximum value for my card. I'll dig that further....
Daniel later reported: the Linux driver "corrects" the raw values (I believe that is made on
purpose for having some standard grid between different TV cards):
1) the signal quality is multiplied by 5./4. which corresponds to the jump I observed from ~60% to ~70%.
2) the SNR is encoded in a really weird manner. The chipset manual tells a cryptic:
"A simple C/N estimator can be easily implemented by comparing the current indications with a primarily-recorded look-up table."
The Linux drivers uses a conversion: ((65535-RAW_SNR)-41216)*3 / 65535 to get a value close to 1 at the card maximum.
After "googling" a bit I found an obscure translation from raw values to dB:
19.02-0.0017*RAW_SNR which seems to correspond to the windows drivers values.
I've applied both these back transformations to get values more common to what I used to get before.
Still no clue on BER units. To what I've read so far I think I should divide my numbers by 2^12, 2^14, 2^16 or 2^18 (pick yours).
Aligning the results with the MRTG graphs
Now for the html plots alignment; the left edges of the actual plot plots are respectively 65
pixels and 81 pixels right of the picture left edge. The difference is then 15
pixels. I think that the most compatible way (at least for modern browsers) is to do something like:
<td style="padding-left: 15px;">
   <a href="http://cpm-ws4.ulb.ac.be/....
During 2008, the newer Dexatek and DVBWorld USB 2.0 boxes have come into
wide use, partially because they don't require you to open the PC to use them,
and partially because they offer such good performance. However, there is
no b2status.exe program supplied with these boxes, so signal strength monitoring
has been more difficult. However, I have now written a small program
called DVBreport.exe which does a similar job the the combination of the Perl
script and b2status.exe method described above. If you want to try this
experimental program, you can download it as part of the b2status.zip
package, and put it in the same directory as your MRTG configuration
file. It has been tested with the Dexatek software with both the DVBWorld and Dexatek boxes. Its settings are configured for the Eurobird-9A
service, and with a simple command-line switch, the same program can also be
used for the Envisat-DDS service on Eutelsat W2A at 10�East.
To test whether the program works on your system, simply run it from the command
line, and ensure that you get four lines of numbers as an output:
C:\> DVBreport
85
65
0
0
C:\>
It seems that the DVB-S2 boxes may not output all the data using this
program. Sample command for MRTG when using the program are:
#---------------------------------------------------------------
#	PC Gemini - EUMETCast quality and SNR
#---------------------------------------------------------------

Target[SkyStar_Gemini_SNR]: `DVBreport.exe`
MaxBytes[SkyStar_Gemini_SNR]: 120
MaxBytes2[SkyStar_Gemini_SNR]: 120
Unscaled[SkyStar_Gemini_SNR]: dwmy
Title[SkyStar_Gemini_SNR]: Dexatek DVB USB box on PC Gemini, Edinburgh
Options[SkyStar_Gemini_SNR]: integer, gauge, nopercent, growright, unknaszero
YLegend[SkyStar_Gemini_SNR]: Qual, Strength
ShortLegend[SkyStar_Gemini_SNR]: %
LegendI[SkyStar_Gemini_SNR]: Quality:
LegendO[SkyStar_Gemini_SNR]: Strength:
Legend1[SkyStar_Gemini_SNR]: Signal Quality (0..120%)
Legend2[SkyStar_Gemini_SNR]: Signal Strength (0..120%)
PageTop[SkyStar_Gemini_SNR]: <H1>Dexatek DVB USB box Quality & Strength snapshots - Edinburgh</H1>

#---------------------------------------------------------------
Uploading the data
Once you have MRTG creating the HTML and PNG files, you will need to create a
routine job to upload those files to your Web server, and schedule that job with
the Windows scheduler. I update every 30 minutes, the choice of update
frequency is yours. Use the Advanced settings in the Windows Scheduler to
repeat the upload task every 30 minutes for a duration of 24 hours, and schedule
the overall task to run every day. Notes
on using the Windows scheduler.
Scheduled command file - e.g. C:\Tools\UploadMRTG.cmd
----------------------------------------------------------------------
REM Go to where the MRTG HTML output is:
PUSHD  C:\Web\LocalCopy\

REM Call FTP with redirected input:
FTP -n -i -s:C:\Tools\UploadMRTG.ftp

POPD
EXIT
----------------------------------------------------------------------
FTP commands - e.g. C:\Tools\UploadMRTG.ftp
----------------------------------------------------------------------
open ftp.<my.web.space>
user <user-name> <password>

cd /mrtg/
lcd \Web\LocalCopy\
prompt			N.B. only required for MOVEit Freely.
type ascii
mput *.html
type binary
mput *.png

quit
----------------------------------------------------------------------
Well, I expect you get the idea..... I found that the Windows-supplied
command-line FTP program tended to hang with my ISP's Web provision, so I now
use MOVEit
Freely
from Standard Networks
instead. Almost identical command syntax, but you need to turn off
per-file prompting with the "prompt" command, as shown above. If you are new to
command-line FTP, there are some hints
and tips here.
Fred van den Bosch posted the following information in the MSG-1
self-help group
for those who wish to monitor the size of the TelliCast FSY database file(s).
You can see Fred's results here.
Fred writes: With some trial and error I found something (don't dare to call it a
solution yet). At least it works for 0.fsy. I can only test it when a 1.fsy file is generated, so I hope I can never test this :-)
For those who already have a 1.fsy and want to test it this is the whole content of
fsysize.pl. Crazy language, that Perl. Why crazy? Well during testing I noticed that fields I set within
the "if" has no value outside the "if". ?????? I agree, I know nothing about Perl (and after the above experiences
I like to keep it that way), so there's a good chance I do something completely wrong. But it works and that's all that matters.
Later: Nice language, that Perl. Thanks to hint from Rob Alblas I understand now what was wrong.
My means to declare a variable and this I did a couple of times. So the revised (and hopefully final) version is now:
use File::stat;
chdir("z:");
chdir("/receiving");
my $fsysiz0 = 0;
my $fsysiz1 = 0;
$fsysiz0 = stat("0.fsy")->size;
$sb=$fsysiz0 * 0.000001;
$dev = stat("1.fsy");
if ($dev > 0) {
	$fsysiz1 = stat("1.fsy")->size;
}
$sb=($fsysiz0 + $fsysiz1) * 0.000001;
print "0\n";
print "$sb\n";
print "0\n";
print "0\n";
Based on Fred's work above, I also added FSY file size monitoring. I
used an alternative Perl script which takes the directory to be monitored as a
parameter. I also made the "check status and report" size part a
Perl subroutine so that it could be extended to any number of FSY files, and
returned the value as bytes rather than megabytes, as MRTG is quite happy
handling large numbers. In the example below, up to three FSY files are
checked, for a RAMdisk size of up to about 380MB (the EUMETSAT recommendation is
a RAMdisk size of 300MB).
----------------- File: FSYsize.pl -----------------------------------
use File::stat;
chdir ($ARGV[0]);	# read the command-line argument

sub fsysize
# procedure to extract file size, if the file exists
# Otherwise it returns 0
{
	$dev = stat ($_[0]);
	if ($dev > 0) {
		stat ($_[0])->size;
	}
}

$total = &fsysize ("0.fsy") + &fsysize ("1.fsy") + &fsysize ("2.fsy");
print "0\n";
print "$total\n";
print "0\n";
print "0\n";
----------------------------------------------------------------------
The commands for MRTG then look like this:
#---------------------------------------------------------------
#	PC Stamsund - FSY File Size
#---------------------------------------------------------------
Target[Stamsund-fsy]: `perl FSYsize.pl Z:/receiving`
MaxBytes[Stamsund-fsy]: 313900000
Options[Stamsund-fsy]: integer, gauge, nopercent, growright, unknaszero, noi
Unscaled[Stamsund-fsy]: dwmy
YLegend[Stamsund-fsy]: FSY size
ShortLegend[Stamsund-fsy]: B
LegendO[Stamsund-fsy]: Size
Legend2[Stamsund-fsy]: FSY file size
Title[Stamsund-fsy]: Stamsund FSY file total size - 314,572,800 byte (300MB) RAMdisk
PageTop[Stamsund-fsy]: <H2>PC Stamsund - FSY Files Total Size</H2>
#---------------------------------------------------------------
I wrote a small program which
takes a PC node name as a parameter, reads the output from the TelliCast HTML
Shell, Statistics screen, and returns the result to standard output. The
program was updated on 2008 Aug 21 to work with both the V2.4.4B and the later
V2.4.4.a TelliCast client software. Place
TelliCastStats.exe in your MRTG\bin directory, and ensure that the run-time
libraries are installed on the system. If you have a software firewall
installed, you may need to give the program permission to access the local
network. You can use that program together with MRTG like this, where hermes
is the TCP/IP node name for the PC you wish to monitor:
#---------------------------------------------------------------
# PC Hermes - TelliCast statistics
#---------------------------------------------------------------
Target[Tellicast-Hermes]: `TelliCastStats hermes`
MaxBytes[Tellicast-Hermes]: 1000000
Options[Tellicast-Hermes]: unknaszero, growright, logscale, nopercent, withzeroes, perhour
YLegend[Tellicast-Hermes]: Packets / hour
ShortLegend[Tellicast-Hermes]: packets / hour
LegendI[Tellicast-Hermes]: Recovered packets
LegendO[Tellicast-Hermes]: Missed packets
Title[Tellicast-Hermes]: TelliCast Statistics - on main PC Hermes
Legend1[Tellicast-Hermes]: Recovered Data Packets
Legend2[Tellicast-Hermes]: Missed Data Packets before FEC
PageTop[Tellicast-Hermes]: <H1>TelliCast Statistics - on main PC Hermes</H1>
#---------------------------------------------------------------
John Say has kindly contributed an alternative way of
using the TelliCastStats.exe program to show lost packets. Here is his
note:
After several days running, I have changed my mind and after all think this
produces a useful result for lost (unrecovered) packets.
The Perl script is:
$pkt_str = `TelliCastStats <name> -all`;
$rec = (split(/\n/,$pkt_str))[0];
$miss = (split(/\n/,$pkt_str))[1];
$loss = ($miss - $rec);
print "$loss\n";
print "0\n";
print "0\n";
print "0\n";
Note that the <name> could include a port number (e.g.
eumetcast-pc:2517) with the TelliCastStats.exe from 2014-Nov-23 and later. A sample of the results is here:

Testing the scripts
To help you test an installation on your own system, I would first suggest
getting Perl, MRTG and SNMP installed on your system, and getting the network
throughput data from the DVB card correctly plotted.
Alan Banks comments: If you need to fault find the cfg file go to
C:\mrtg-2.15.0\bin ( or wherever you put mrtg.cfg)
perl mrtg mrtg.cfg
This will tell you what errors there are in the file if it wont start.
When you have it working, close the command window, re-open go to
C:\mrtg-2.15.0\bin and type
wperl mrtg mrtg.cfg
Check wperl is in processes in Task Manager and then close the cmd
prompt. [DJT note: I just use Perl and not WPerl]
Once you have the throughput correctly plotting and updating, progress to the scripts above.
Here are some debugging hints:
Is the SkyStar card installed in the system where you are
running MRTG? OK, I thought it was!
When you run B2STATUS.exe, does it produce something like
this?
C:\> b2status -ti
************* Current Tuner information: ****************
Tuner type : Satellite
Status In Lock : YES
Signal Strength : n/s
Signal Quality : 65 %
SNR : 8.651000
BER : 0.000000
Total Blocks : n/s
Corrected Blocks : n/s
Uncorrected Blocks : 0
Settings Frequency : 10853 MHz
Symbol Rate : 27500 kS/s
FEC : 3/4
Polarity : HORIZONTAL
Modulation : n/s
Diseqc : NONE
LNB Frequ. : 9750 MHz
LNB Select. : 0 kHz
Guard Interv. : n/s
Bandwidth : n/s
*********************************************************
C:\>
It is this output which the Perl Script parses.
Finally, running the command from the Command prompt:
perl SkyStarQualSNR.pl
should produce 4 lines of output, something like:
65
86
0
0
Please note that we have also found
that the BER is almost always zero on some cards, unless the signal is about to
crash completely through the floor!
David Taylor
2011 Jan 08

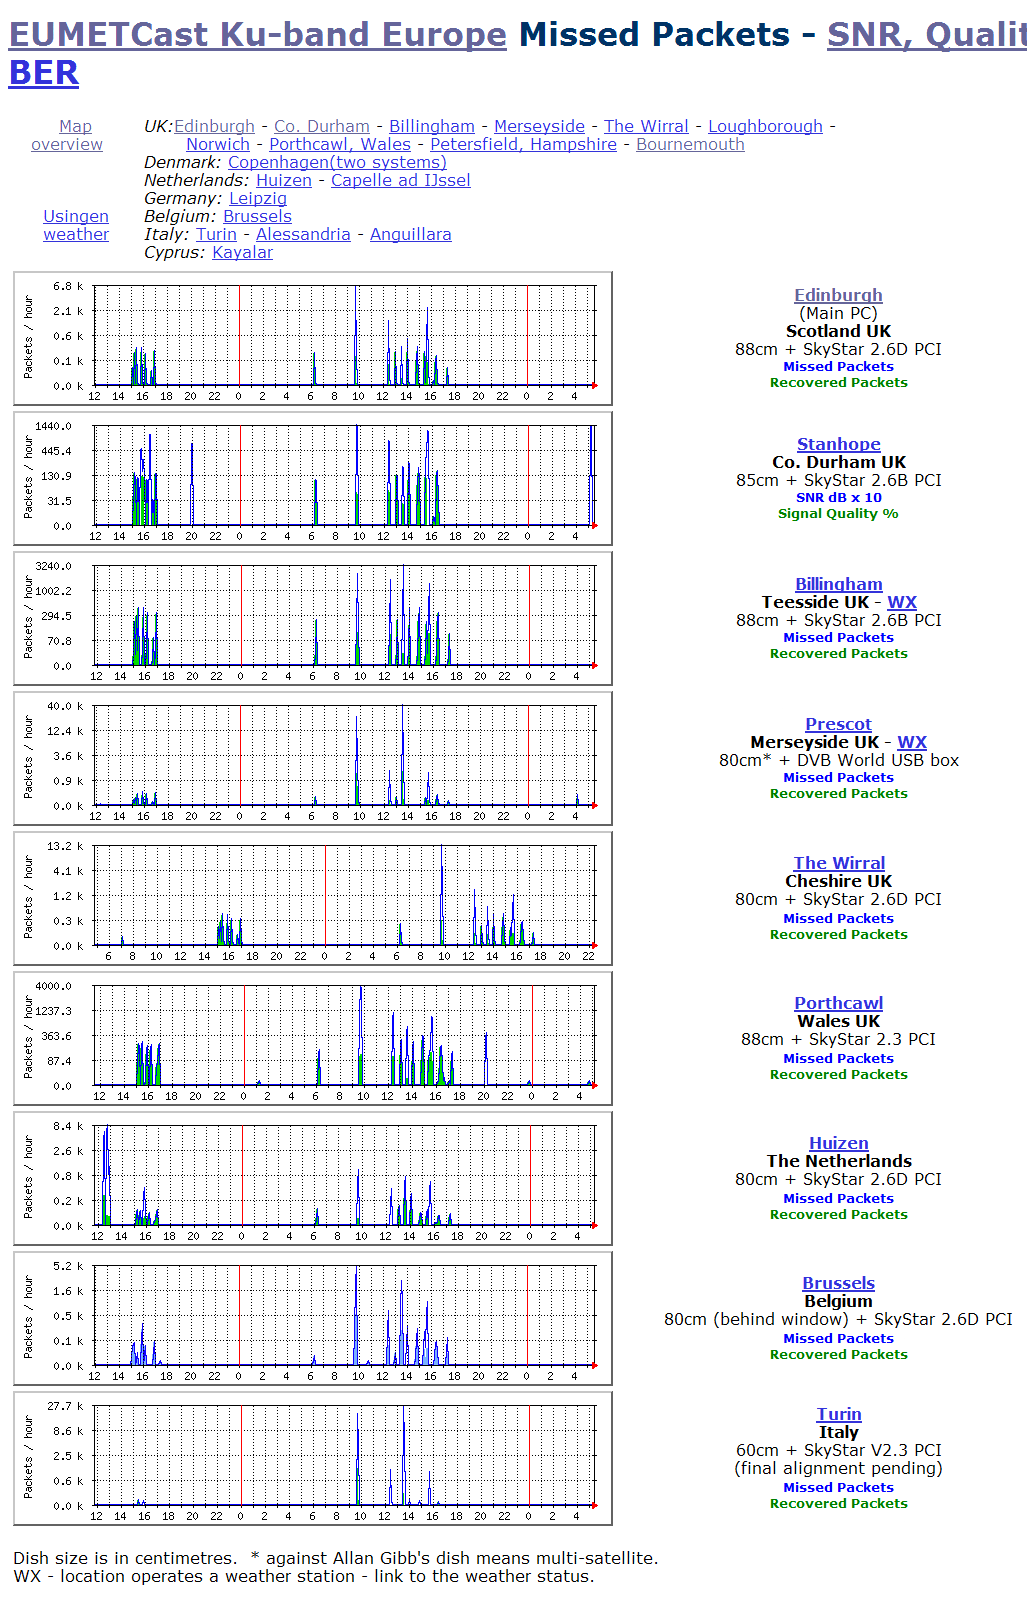
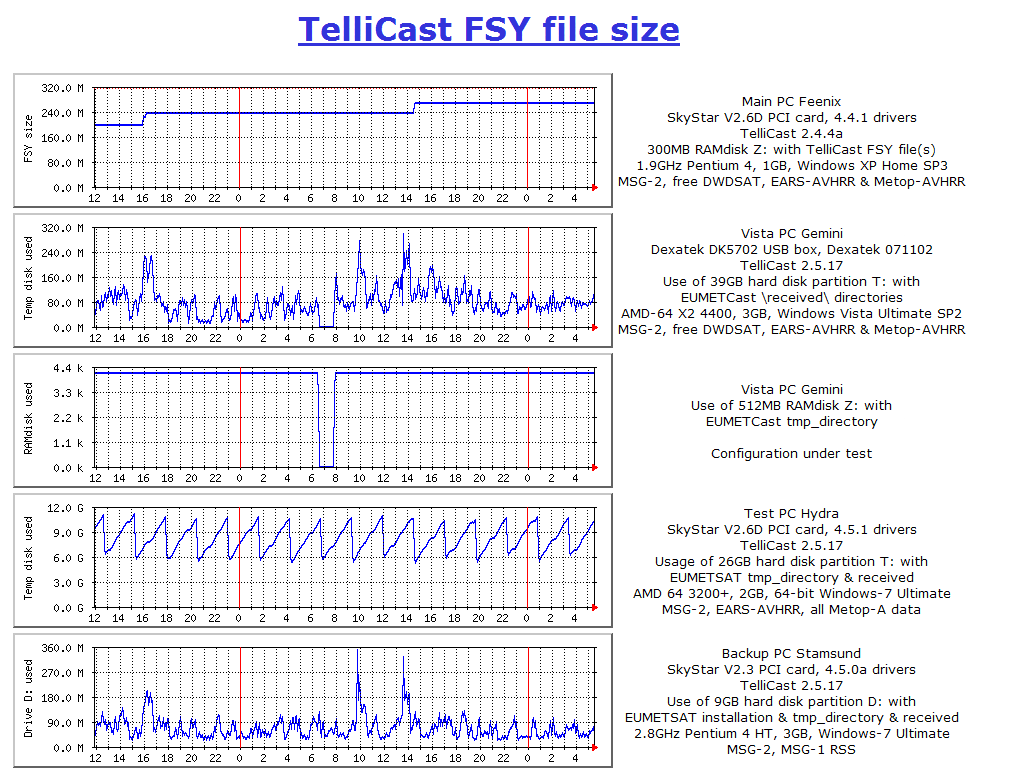
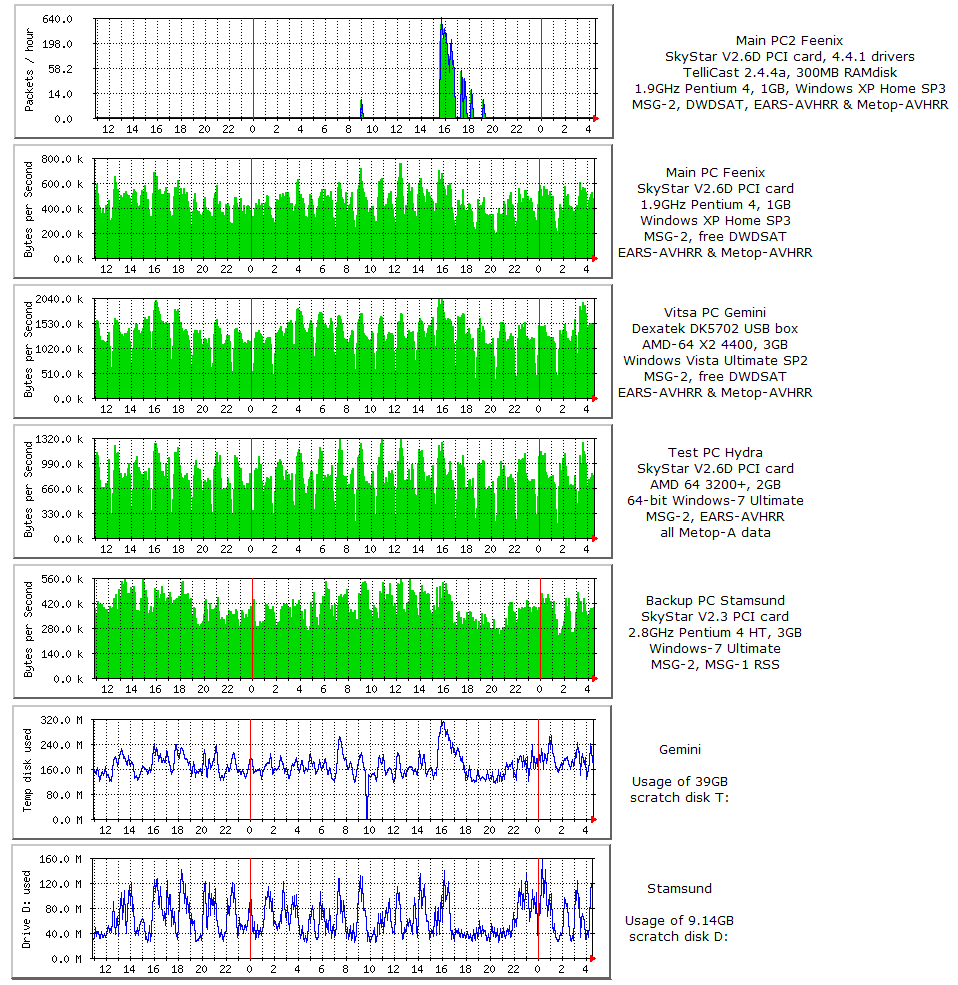
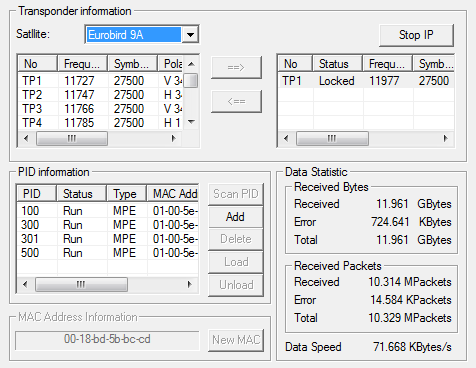
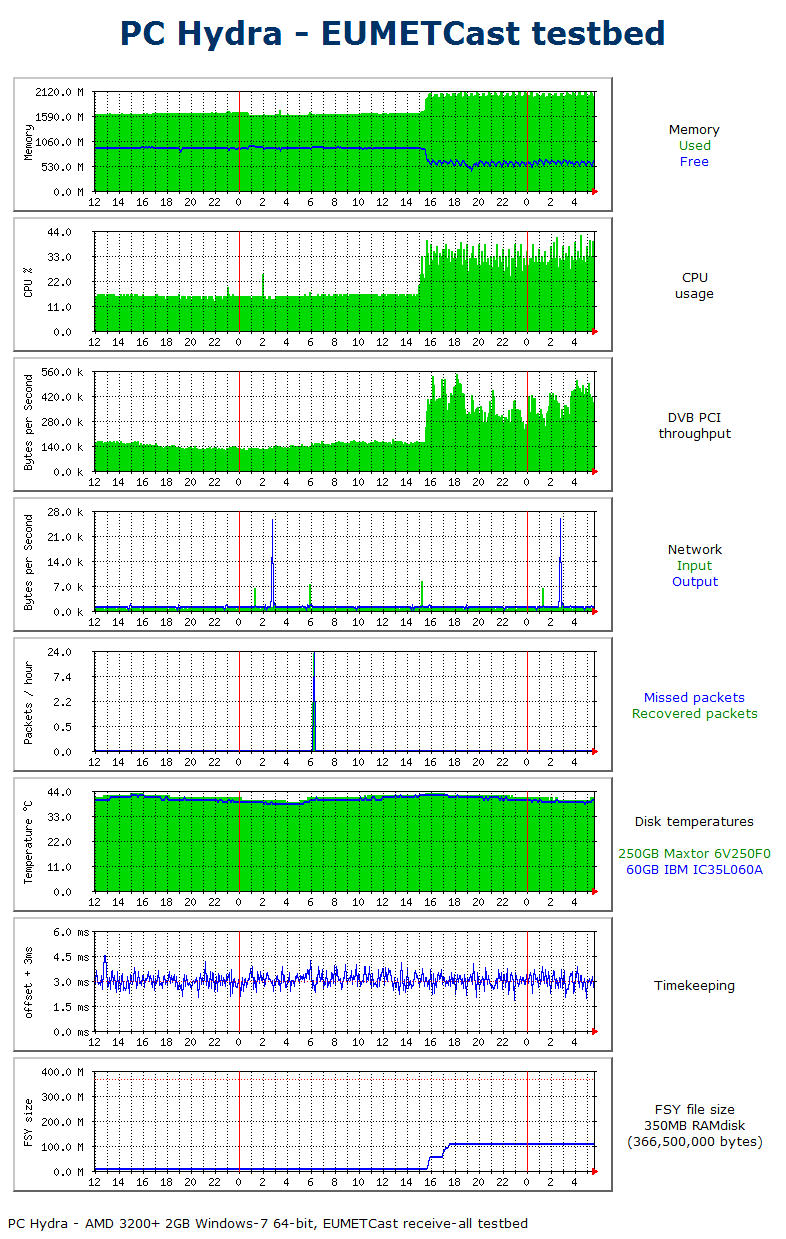
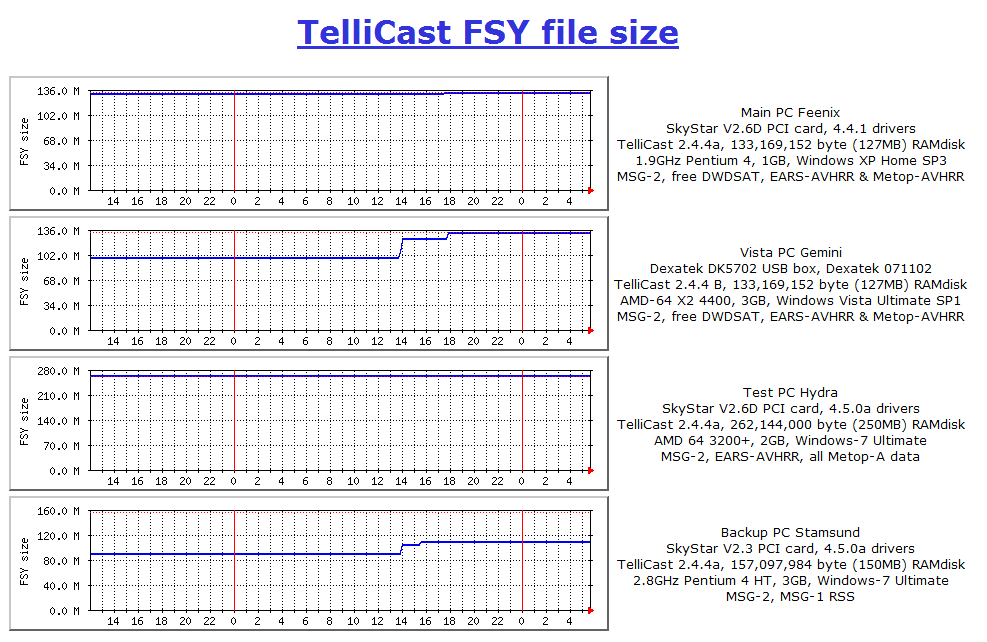
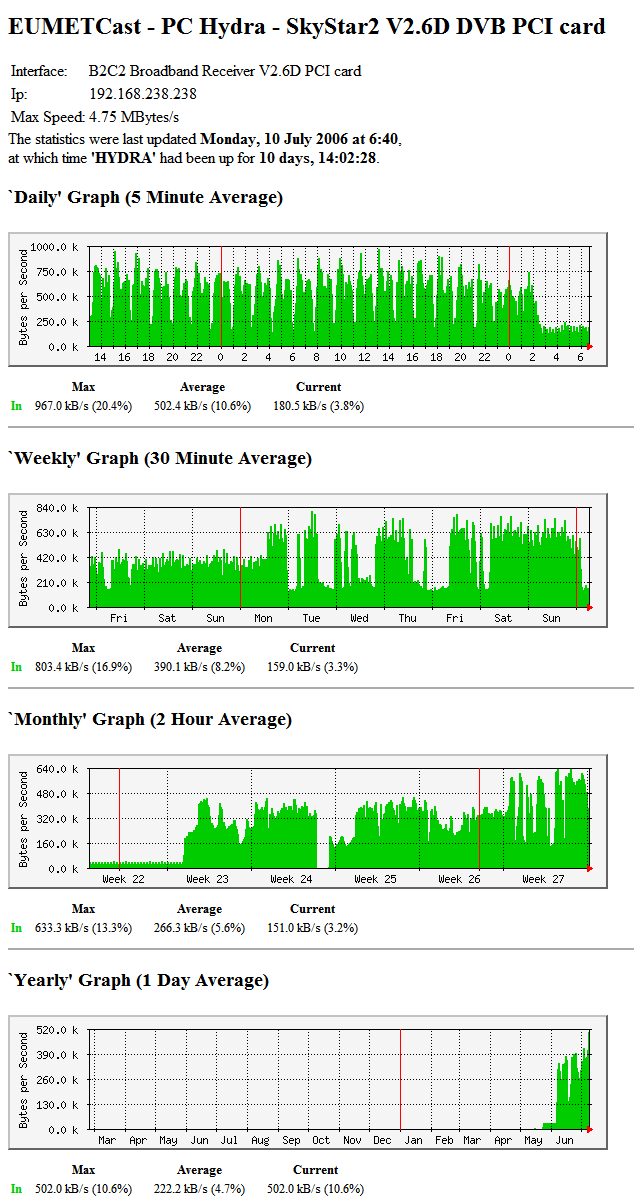