


|
|
Using MRTG with EUMETCastMost of this information related to the Ayecka SR1 receiver, which has excellent monitoring capabilities, but some of the throughput and TelliCast loss monitoring can be dome with any receiver. For the success using the commands below, please be sure to update your SR1 software to the current version (1.05b243). I have presented the configuration files as a base file, to which you can add the include files as you desire and as your expertise in using MRTG builds. Please be careful when copying and pasting the examples below - sometime a very long line will wrap and produce errors from MRTG. There is information on other EUMETCast monitoring with MRTG here.
Back to DVB-S2 testing information Base MRTG fileAssign the directories to suit your own system. In the example below, I have split the configuration files into a base file (MRTG.CFG) and several include files (of type .INC). The include files, together with any Perl scripts (file type .PL), can all live in the same directory, such as C:\Tools\mrtg\bin\. I suggest putting the HTML and Image files into a common directory so that you can easily upload them to your Web server on the Internet. Note also that you may need to create the LogDir, HtmlDir and ImageDir directories yourself - MRTG may not do it for you. Look for any error messages the first time you run MRTG. If you are already running a local Web server its /mrtg/ directory might be a suitable choice, if it has one. Leave the "Timezone[_]: UTC" as reporting world-wide is in UTC and not local time. Note that if you are running the older 1.05b232 software you will need the SingleRequest: Yes line in the MRTG configuration file. It is not needed for the more recent 1.05b243 software which supports SNMP "bulk" requests.
Running MRTGThese notes are written on the assumption that you are extending an existing MRTG installation on your PC at add some EUMETCast monitoring. There are more notes on other MRTG monitoring such as CPU and memory usage here. Once you have MRTG downloaded and expended into a directory such as C:\Tools\, you should find directories including: C:\Tools\MRTG C:\Tools\MRTG\bin C:\Tools\MRTG\lib C:\Tools\MRTG\images The configuration file is named mrtg.cfg, and should be edited in notepad. There's a sample just above. To keep the file relatively clean, I have used the "include" ability to add monitoring for the various parameters I need. Using Include files means that if you edit and break something you can just comment out the Include file while you sort out the problem. To run Perl, I suggest you create a small script which runs the Perl interpreter with the main ~107 kB mrtg file as a parameter, and that file itself need a parameter to tell it where to find its configuration file, so you end up with a command like: perl mrtg mrtg.cfg I find it helpful to see that I have tried to start MRTG, but I want to run it minimised, so I end up with a command file like:
where the TIMEOUT command allows me to see on the screen that the command has
been started, and using the START command allows me to run MRTG minimised.
You will have your own preferred way for doing this. If you need to change
anything you will need to restart MRTG, by using right-click, Close on the
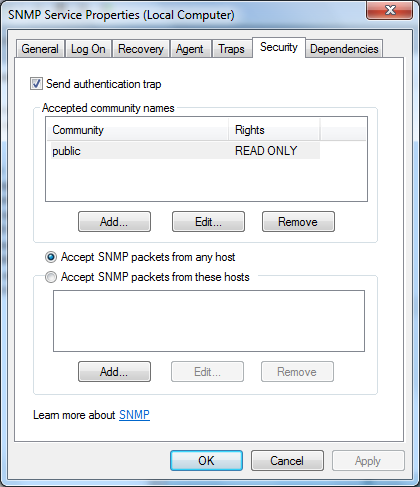
minimised command window. Network throughput for multiple adapters on your PCNetwork I/O is really what MRTG was designed for, so it's the basic use of the software. You can read all about MRTG here, but here are some brief notes. You will need to install and enable Windows SNMP on your PC for monitoring of the PC to work. With later versions of Windows, you may also need to set the SNMP service, Properties, Security tab to have the following settings. If you want slightly better security, set the Accept packets from to at least include 127.0.0.1 First, an include file for monitoring a single network connection on a PC.
You can also use the network number, but using the IP address is easier as it doesn't change as the network number can.
In the above case, the network interface number (10) was derived by running the cfgmaker program supplied with the MRTG distribution. MRTG will need to know either the IP address of the adapters, or the network number assigned to the adapters. Typically in the installations we are using for TelliCast the IP addresses will be fixed, and the network numbers may vary when devices are added or removed or when a major Windows update takes place. To find the network interface numbers easily, you can use the command: route print /4. Here is an edited sample output: C:\Users\David>route print /4 =========================================================================== Interface List 21...6c fd b9 00 6f 42 ......Realtek PCI GBE Family Controller 10...20 cf 30 c7 bb 49 ......Realtek PCIe GBE Family Controller You can see that this PC has two network adapters, and you would need to distinguish between the numbers 10 and 21. You should already know the IP addresses, but if not you can enter the command: ipconfig, or, for more detail: ipconfig /all. Here's the edited output: C:\Users\David>ipconfig Ethernet adapter EUMETCast SR1: Connection-specific DNS Suffix . : IPv4 Address. . . . . . . . . . . : 192.168.10.104 Subnet Mask . . . . . . . . . . . : 255.255.255.0 Default Gateway . . . . . . . . . : Ethernet adapter House LAN: Connection-specific DNS Suffix . : IPv4 Address. . . . . . . . . . . : 192.168.0.1 Subnet Mask . . . . . . . . . . . : 255.255.255.0 Default Gateway . . . . . . . . . : 192.168.0.10 and from: ipconfig /all
You can see that I renamed the adapters so that the one connected to the house LAN was more obvious, and that is the PICe controller on IP 192.168.0.1, and the controller on network number 10 is the adapter connected to the SR1 traffic port. So either of the following methods could be used to specify monitoring of that networks:
Monitoring the traffic accepted by your PC from the SR1Here is an example to monitor the traffic accepted by your PC from the SR1. This will be less than the traffic sent from your SR1 as the traffic will be limited to just those channels you have selected in the channel configuration file.
|
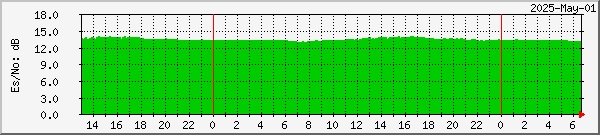
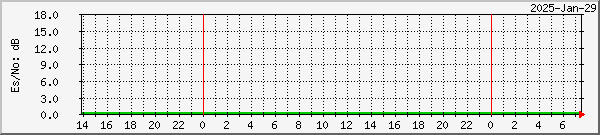
# File sr1-snr.inc #--------------------------------------------------------------- # SR1 - receiver Es/No #--------------------------------------------------------------- Target[SR1-snr]: 1.3.6.1.4.1.27928.101.1.1.4.4&1.3.6.1.4.1.27928.101.1.1.4.4:public@192.168.10.99 MaxBytes[SR1-snr]: 180 YTics[SR1-snr]: 6 YTicsFactor[SR1-snr]: 0.1 Factor[SR1-snr]: 0.1 Unscaled[SR1-snr]: dwmy Title[SR1-snr]: Ayecka SR1 Es/No Options[SR1-snr]: gauge, nopercent, growright, unknaszero, noo ShortLegend[SR1-snr]: dB YLegend[SR1-snr]: Es/No: dB LegendI[SR1-snr]: Es/No: Legend1[SR1-snr]: Received Es/No (signal-to-noise ratio) PageTop[SR1-snr]: <H1>Ayecka SR1 - Es/No (Edinburgh)</H1> #--------------------------------------------------------------- |
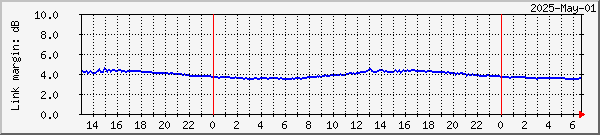
Thanks to some programming by software guru Francis Breame, we now have a better way of measuring the link margin for the two services separately. Francis has provided a Zip file containing his program and notes regarding using it in MRTG, and you can download those notes here. This is an extract from the first release of those notes. I found that I could not get the Net::SNMP module (or any module) with the version of Perl I had installed perhaps a decade back, but it was fine on a recent installation of 32-bit ActiveState Perl 5.16.1.1601 as described here. You will need to alter the directories below to meet your own local configuration. I've slightly edited Francis's notes below to make some of the file names clearer.
Francis Breame writes:
This Perl script generates separate link margin statistics for both the basic and high volume modcods using by EUMETCast DVB-S2, and formats them for display by MRTG. As the modcods change unpredictably, it has to sample the vales fairly quickly, and therefore has to run continuously. It produces a file which can then be input by MRTG.
Note 1: In the remarks from Francis Breame above he has used the file: E:\MRTG\mib\SR1-lm.txt, whereas in the example below my own file was in: C:\Tools\MRTG2\bin\SR1-lm.txt. Adapt to suit your own arrangement, of course.
Note 2: You may want to delay starting MRTG by 30 seconds or so after starting the SR1lm.pl Perl script so that some correct data is available when Perl has its first check. Simply add the command: timeout 30 to the script running MRTG. After the version of 2014-Sep-11 this should no longer be required.
2014-Sep-06, minor updates to the Perl script to eliminate some minor and
infrequent errors. No changes required to the MRTG configuration script.
2014-Sep-11, minor updates to the Perl script to prevent writing zero values
until new values have been established at startup.
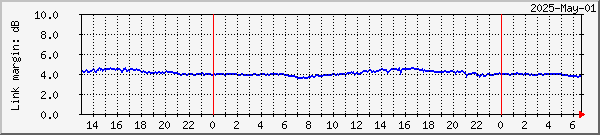
# File: sr1-dual-link-margin.inc #--------------------------------------------------------------- # SR-1 DVB-S2 receiver #1 dual link margin #--------------------------------------------------------------- Target[SR1-dual-link-margin]: `type C:\Tools\MRTG2\bin\SR1-lm.txt` MaxBytes1[SR1-dual-link-margin]: 100 MaxBytes2[SR1-dual-link-margin]: 100 Unscaled[SR1-dual-link-margin]: dwmy YTics[SR1-dual-link-margin]: 5 YTicsFactor[SR1-dual-link-margin]: 0.1 Factor[SR1-dual-link-margin]: 0.1 Options[SR1-dual-link-margin]: gauge, nopercent, growright, unknaszero, nolegend ShortLegend[SR1-dual-link-margin]: dB YLegend[SR1-dual-link-margin]: Link margin: dB LegendI[SR1-dual-link-margin]: Basic Service: LegendO[SR1-dual-link-margin]: High Volume Service: Title[SR1-dual-link-margin]: SR1 #1 Link Margins PageTop[SR1-dual-link-margin]: <h1>Ayecka SR1 #1 - Link Margins (Edinburgh)</h1> #--------------------------------------------------------------- |
When the HVS-2 service started it no longer uses the mixed MODCODs which characterise the transponder 1 data, mixing Basic Service and High Volume Service on the single channels. I made a simple update to Francis Breame's Perl script and include file used in the dual link margin method above here.
(This is rendered obsolete by the dual margin method detailed above. Only use the method below if you have problems getting the dual link margin working - the method below is better than nothing!).
# File sr1-link-margin.inc #--------------------------------------------------------------- # SR-1 DVB-S2 receiver link margin #--------------------------------------------------------------- Target[SR1-link-margin]: 1.3.6.1.4.1.27928.101.1.1.4.6&1.3.6.1.4.1.27928.101.1.1.4.6:public@192.168.10.99 MaxBytes[SR1-link-margin]: 120 YTics[SR1-link-margin]: 6 YTicsFactor[SR1-link-margin]: 0.1 WithPeak[SR1-link-margin]: wmy Unscaled[SR1-link-margin]: dwmy Title[SR1-link-margin]: Ayecka SR1 Link margin Options[SR1-link-margin]: integer, gauge, nopercent, growright, unknaszero, noo ShortLegend[SR1-link-margin]: . YLegend[SR1-link-margin]: Link margin LegendI[SR1-link-margin]: 10 x Link margin dB: Legend1[SR1-link-margin]: Link margin x 10 PageTop[SR1-link-margin]: <H1>Ayecka SR1 - link margin (Edinburgh)</H1> #--------------------------------------------------------------- |
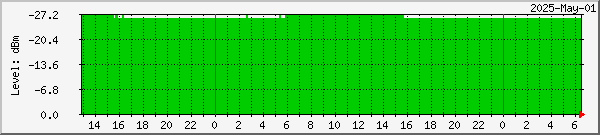
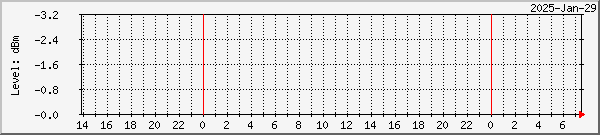
# File: sr1-level.inc #--------------------------------------------------------------- # SR1 - receiver signal level #--------------------------------------------------------------- Target[SR1-dBm]: 1.3.6.1.4.1.27928.101.1.1.4.3.0&1.3.6.1.4.1.27928.101.1.1.4.3.0:public@192.168.10.99 * -1 MaxBytes[SR1-dBm]: 1500 Title[SR1-dBm]: Ayecka SR1 Level Options[SR1-dBm]: gauge, nopercent, growright, unknaszero, noo ShortLegend[SR1-dBm]: dBm YTicsFactor[SR1-dBm]: -0.1 Factor[SR1-dBm]: -0.1 YLegend[SR1-dBm]: Level: dBm LegendI[SR1-dBm]: Level: Legend1[SR1-dBm]: Level below 0 dBm. A lower plotted value means a bigger signal! PageTop[SR1-dBm]: <H1>Ayecka SR1 - Signal Level (Edinburgh)</H1><br>Lower value means greater signal! #--------------------------------------------------------------- |
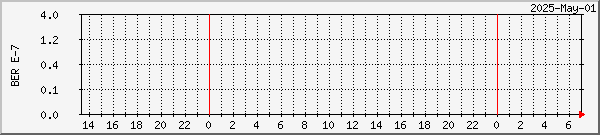
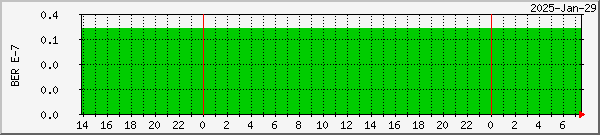
# File: sr1-ber.inc #--------------------------------------------------------------- # SR1 - receiver BER #--------------------------------------------------------------- Target[SR1-ber]: 1.3.6.1.4.1.27928.101.1.1.4.5.0&1.3.6.1.4.1.27928.101.1.1.4.5.0:public@192.168.10.99 MaxBytes[SR1-ber]: 10000000 Title[SR1-ber]: Ayecka SR1 BER Options[SR1-ber]: noo, gauge, nopercent, growright, logscale, withzeroes, unknaszero ShortLegend[SR1-ber]: E-7 YLegend[SR1-ber]: BER E-7 LegendI[SR1-ber]: BER: Legend1[SR1-ber]: Demodulator Bit Error Rate - BER - 10E-7 PageTop[SR1-ber]: <H1>Ayecka SR1 - BER (Edinburgh)</H1> #--------------------------------------------------------------- |
Note: where a PageTop entry stretches over multiple lines, such as in the [SR1-Traffic] target below, each line after the first must be start with a space character, as the first line which does not start with a space will terminate the PageTop entry.
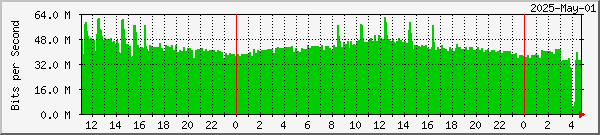
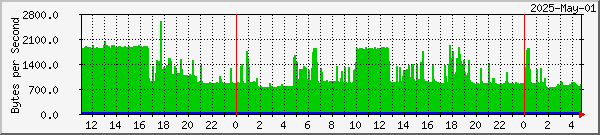
# File: sr1-traffic.inc #--------------------------------------------------------------- # SR1 - "Traffic LAN" output #--------------------------------------------------------------- Target[SR1-Traffic]: 1.3.6.1.2.1.2.2.1.16.1&1.3.6.1.2.1.2.2.1.16.1:public@192.168.10.99 MaxBytes[SR1-Traffic]: 150000000 Options[SR1-Traffic]: bits, unknaszero, growright, noo Title[SR1-Traffic]: Ayecka SR1 Traffic LAN PageTop[SR1-Traffic]: <H1>Ayecka SR1 - Traffic LAN (Edinburgh)</H1> <TABLE> <TR><TD>Interface:</TD><TD>Ayecka SR1 Traffic LAN</TD></TR> <TR><TD>Max Speed:</TD><TD>1 Gbit/s</TD></TR> </TABLE> #--------------------------------------------------------------- # SR1 - "Management LAN" input and output #--------------------------------------------------------------- Target[SR1-Management]: 1.3.6.1.2.1.2.2.1.10.2&1.3.6.1.2.1.2.2.1.16.2:public@192.168.10.99 MaxBytes[SR1-Management]: 15000000 Options[SR1-Management]: unknaszero, growright Title[SR1-Management]: Ayecka SR1 Management LAN PageTop[SR1-Management]: <H1>Ayecka SR1 - Management LAN (Edinburgh)</H1> <TABLE> <TR><TD>Interface:</TD><TD>Ayecka SR1 Management LAN</TD></TR> <TR><TD>Max Speed:</TD><TD>100 Mbit/s</TD></TR> </TABLE> #--------------------------------------------------------------- |
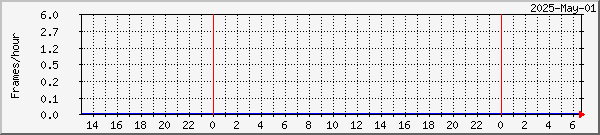
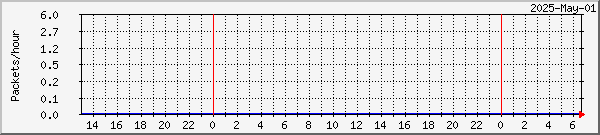
# File: sr1-frames.inc #--------------------------------------------------------------- # SR1 Bad Frames #--------------------------------------------------------------- Target[SR1-bad-frames]: 1.3.6.1.4.1.27928.101.1.1.4.15.0&1.3.6.1.4.1.27928.101.1.1.4.15.0:public@192.168.10.99 RouterUptime[SR1-bad-frames]: public@192.168.10.99 MaxBytes[SR1-bad-frames]: 9000 YTics[SR1-bad-frames]: 6 YLegend[SR1-bad-frames]: Frames/hour ShortLegend[SR1-bad-frames]:   LegendO[SR1-bad-frames]: Frames/hour Legend2[SR1-bad-frames]: SR1 bad frame rate Options[SR1-bad-frames]: unknaszero, growright, logscale, nopercent, withzeroes, perhour, noi Title[SR1-bad-frames]: SR1 Bad Frame Rate PageTop[SR1-bad-frames]: <H1>Ayecka SR1 Bad Frame Rate</H1> #--------------------------------------------------------------- # SR1 Bad Packets #--------------------------------------------------------------- Target[SR1-bad-packets]: 1.3.6.1.4.1.27928.101.1.1.4.16.0&1.3.6.1.4.1.27928.101.1.1.4.16.0:public@192.168.10.99 RouterUptime[SR1-bad-packets]: public@192.168.10.99 MaxBytes[SR1-bad-packets]: 9000 YTics[SR1-bad-packets]: 6 YLegend[SR1-bad-packets]: Packets/hour ShortLegend[SR1-bad-packets]:   LegendO[SR1-bad-packets]: Bad packets/hour Legend2[SR1-bad-packets]: SR1 bad packet rate Options[SR1-bad-packets]: unknaszero, growright, logscale, nopercent, withzeroes, perhour, noi Title[SR1-bad-packets]: SR1 Bad Packet Rate PageTop[SR1-bad-packets]: <H1>Ayecka SR1 Bad Packet Rate</H1> #--------------------------------------------------------------- |
Here is the extra code for collecting TelliCast statistics - here for a PC
named "Molde". You could use the Include: MRTG directive to add
it to an existing data collection configuration. The program
TelliCastStats.exe and the Perl script used by the two targets below may be
obtained here. Note the
back quotes (` - top-left on my keyboard) round the program and its argument.
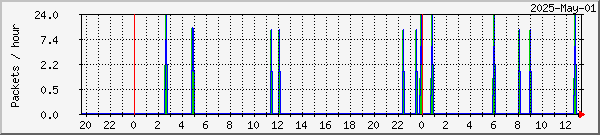
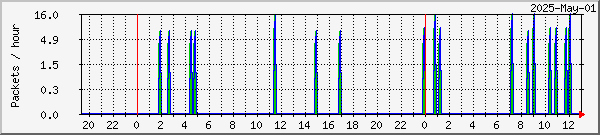
# File: tellicast-molde.inc #--------------------------------------------------------------- # TelliCast losses - Molde #--------------------------------------------------------------- Target[Tellicast-Molde-lost]: `perl TelliCastLost.pl` MaxBytes[Tellicast-Molde-lost]: 1000000 Options[Tellicast-Molde-lost]: unknaszero, growright, logscale, nopercent, withzeroes, perhour, noi YLegend[Tellicast-Molde-lost]: Packets / hour ShortLegend[Tellicast-Molde-lost]: packets / hour LegendO[Tellicast-Molde-lost]: Lost packets Title[Tellicast-Molde-lost]: TelliCast Lost Packets - on Win-10/64 PC Molde Legend2[Tellicast-Molde-lost]: Lost packets PageTop[Tellicast-Molde-lost]: <H1>TelliCast Lost Packets - on Win-10/64 PC Molde</H1> #--------------------------------------------------------------- # TelliCast statistics - Molde #--------------------------------------------------------------- Target[Tellicast-Molde]: `TelliCastStats Molde:8100` MaxBytes[Tellicast-Molde]: 1000000 Options[Tellicast-Molde]: unknaszero, growright, logscale, nopercent, withzeroes, perhour YLegend[Tellicast-Molde]: Packets / hour ShortLegend[Tellicast-Molde]: packets / hour LegendI[Tellicast-Molde]: Recovered packets LegendO[Tellicast-Molde]: Missed packets Title[Tellicast-Molde]: TelliCast Statistics - on Win-10/64 PC Molde Legend1[Tellicast-Molde]: Recovered Data Packets Legend2[Tellicast-Molde]: Missed Data Packets before FEC PageTop[Tellicast-Molde]: <H1>TelliCast Statistics - on Win-10/64 PC Molde</H1> #--------------------------------------------------------------- |
# File TelliCastLost.pl if ($ARGV[0] eq "") {$ARGV[0] = "127.0.0.1:8100";}
$pkt_str = `TelliCastStats $ARGV[0] -all`;
$recovered = (split(/\n/,$pkt_str))[0];
$missed = (split(/\n/,$pkt_str))[1];
$lost = ($missed - $recovered);
print "$lost\n";
print "$lost\n";
print "0\n";
print "0\n";
|
Lost Basic Service packets
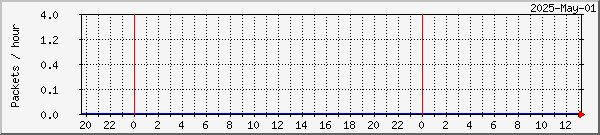
Missed and recovered
Basic Service
packets
If PC Molde was also running the High Volume Service, you would need a second MRTG entry with sections named, for example, [Tellicast-Molde-HVS] and [Tellicast-Molde-lost-HVS], and a second Perl script for port 8200. Here's an example from my PC Lund, an HVS-only receiver PC.
Lost High Volume Service packets

Missed and recovered
High Volume Service
packets
Please note that there is a new version of the TelliCastStat.exe program which allows you to specify the port number as part of the node name. This is provided for the new TelliCast client which by default uses port 8100 for the Basic Service, or 8200 for the high-volume service. When upgrading to the new client, be sure to (a) download the new TelliCastStats.exe program, (b) edit your MRTG.cfg (or the include file), and (c) edit the Perl script.
| Basic service | 8100 |
| High Volume Service 1 | 8200 |
| High Volume Service 2 | 8201 |
| Terrestrial service | 8500 |
You can monitor the size of the RAMdisk using SNMP parameters available in recent versions of Windows. The system had SNMP Informant installed but I don't believe that's required for the disk used. The number of allocation units used is multiplied by the size of each allocation unit. You need to determine the index of the RAMdisk (and this will change if disks are added or USB sticks inserted) and you can do that by browsing the MIB from .1.3.6.1.2.1.25.2.3.1 You could also use the FindDiskIndices.cmd script in this download. Remember to copy the executable SnmpGet.exe from the archive as well as the script. SnmpGet.exe is from: https://syslogwatcher.com/cmd-tools/snmp-get/
If your are familiar with walking MIBs, to the index of the RAMdisk try getting the MIB tree from OID: .1.3.6.1.2.1.25.2.3.1. Using GetIF, enter that OID in the second-top box in GetIF, MBrowser, press Start, and then enter the OID in the lowest box, press Start again.
@ECHO OFF CLS set ip=node-name-or-IP set ip=127.0.0.1 for /L %%D IN (1,1,12) do ( snmpget -q -r:%ip% -p:161 -o:.1.3.6.1.2.1.25.2.3.1.3.%%D | FIND "Failed" > NUL IF ERRORLEVEL 1 ( @ECHO %ip% disk index %%D snmpget -q -r:%ip% -p:161 -o:.1.3.6.1.2.1.25.2.3.1.3.%%D snmpget -q -r:%ip% -p:161 -o:.1.3.6.1.2.1.25.2.3.1.6.%%D snmpget -q -r:%ip% -p:161 -o:.1.3.6.1.2.1.25.2.3.1.4.%%D @ECHO. ) ) PAUSE |
When calculating the value to be used for MaxBytes, remember that the RAMdisk size is typically given in "computer" MB units, i.e. 1024 * 1024 bytes. So that if you have a 1 GB RAMdisk, that's might actually be 1024 * 1024 * 1024 bytes, i.e. 1,073,741,824 bytes. On an MSI RAMdisk I happened to use on PC Lund, the disk in its control panel is shown as "10240 MB", possibly 10,737,418,240 bytes, and with a right-click, Properties from File Explorer it shows: 10,737,417,216 bytes. For simplicity, in the MRTG configuration files I rounded this to 10,800,000,000 bytes (entered without the thousands separators, of course).
Please note that the line "Target[lund-ramdisk]" has been split into two lines for presentation. It should be entered as a single line, with a space on either side of the asterisk.:
Target[lund-ramdisk]: used * allocation-unit
#---------------------------------------------------------------
#	PC Lund - RAMdisk used
#---------------------------------------------------------------

# The RAMdisk is index 3 on this PC (C:, D:, Z:)

Target[lund-ramdisk]: 1.3.6.1.2.1.25.1.7.0&.1.3.6.1.2.1.25.2.3.1.6.3:public@127.0.0.1 *
    1.3.6.1.2.1.25.1.7.0&.1.3.6.1.2.1.25.2.3.1.4.3:public@127.0.0.1
MaxBytes[lund-ramdisk]: 10800000000
Options[lund-ramdisk]: gauge, nopercent, growright, unknaszero, noi
WithPeak[lund-ramdisk]: wmy
YLegend[lund-ramdisk]: RAMisk used (B)
ShortLegend[lund-ramdisk]: B
LegendO[lund-ramdisk]: Space used
Legend2[lund-ramdisk]: RAMdisk used
Title[lund-ramdisk]: Lund - 10 GB RAMdisk
PageTop[lund-ramdisk]: <H1>PC Lund - 10 GB RAMdisk Used (Edinburgh)</H1>

#---------------------------------------------------------------
|
I am also developing a couple of MRTG includes to monitor two directory trees on a RAMdisk (e.g. Z:\EUMETCast\tmp\ and Z:\EUMETCast\received\ ) and to monitor the free space on a RAMdisk. These can be downloaded in beta format here. Note again that for presentation I have split the very long Target line - this time into three segments. Note the additional brackets to ensure the maths is correct!
Target[lund-RAMdisk-free]: (total - used) * allocation-unit
#---------------------------------------------------------------
# Z: trees used - PC Lund
# MaxBytes set to just over RAMdisk size, 10 GB here (I hope!)
# Units are bytes
#---------------------------------------------------------------
Target[Lund-RAMdisk-trees]: `perl GetTreeUsed.pl Z:\EUMETCast\received Z:\EUMETCast\tmp`
MaxBytes[Lund-RAMdisk-trees]: 10800000000
Options[Lund-RAMdisk-trees]: gauge, nopercent, growright, unknaszero
WithPeak[Lund-RAMdisk-trees]: wmy
YLegend[Lund-RAMdisk-trees]: Bytes used
ShortLegend[Lund-RAMdisk-trees]: B
LegendI[Lund-RAMdisk-trees]: Z:\EUMETCast\received
LegendO[Lund-RAMdisk-trees]: Z:\EUMETCast\tmp
Legend1[Lund-RAMdisk-trees]: Used in Z:\EUMETCast\received...
Legend2[Lund-RAMdisk-trees]: Used in Z:\EUMETCast\tmp...
Legend3[Lund-RAMdisk-trees]: Maximum used in Z:\EUMETCast\received...
Legend4[Lund-RAMdisk-trees]: Maximum used in Z:\EUMETCast\tmp...
Title[Lund-RAMdisk-trees]: RAMdisk tree usage on PC Lund
PageTop[Lund-RAMdisk-trees]: <H1>RAMdisk tree usage on PC Lund</H1>
#---------------------------------------------------------------
# Z: RAMdisk free
# For the disk free, you need to know the index of the RAMdisk.
# On PC Lund, the RAMdisk is index 3
#---------------------------------------------------------------
Target[Lund-RAMdisk-free]: (.1.3.6.1.2.1.25.2.3.1.5.3&.1.3.6.1.2.1.25.2.3.1.5.3:public@127.0.0.1 -
.1.3.6.1.2.1.25.2.3.1.6.3&.1.3.6.1.2.1.25.2.3.1.6.3:public@127.0.0.1) *
.1.3.6.1.2.1.25.2.3.1.4.3&.1.3.6.1.2.1.25.2.3.1.4.3:public@127.0.0.1
MaxBytes[Lund-RAMdisk-free]: 10800000000
Options[Lund-RAMdisk-free]: gauge, nopercent, growright, unknaszero, noi
YLegend[Lund-RAMdisk-free]: Free bytes
ShortLegend[Lund-RAMdisk-free]: B
LegendO[Lund-RAMdisk-free]: RAMdisk free
Legend2[Lund-RAMdisk-free]: RAMdisk free on PC Lund
Title[Lund-RAMdisk-free]: RAMdisk free on PC Lund
PageTop[Lund-RAMdisk-free]: <H1>RAMdisk free on PC Lund</H1>
#---------------------------------------------------------------
|
You will also need the Perl script, which is in this archive:
# From: http://www.perlmonks.org/?node_id=2311
# and: https://rt.cpan.org/Public/Bug/Display.html?id=61520

# Note that Windows Vista/Server 2008 or later is required for GetTickCount64.
# This version returns bytes, not MB.

use strict;
use Win32::API;
use Sys::Hostname;

my $GetTickCount;
$GetTickCount = Win32::API->new("kernel32", "int GetTickCount64()");
my $uptime;
my $dir1 = '.';
my $dir2 = '.';

if (@ARGV[0] ne "") {
$dir1 = @ARGV[0];
}

if (@ARGV[1] ne "") {
$dir2 = @ARGV[1];
}

print &dir_tree_size($dir1) . "\n";
print &dir_tree_size($dir2) . "\n";
$uptime = $GetTickCount->Call() / 1000;
printf "%d day(s) %dh %dm\n", int($uptime/86400), int(($uptime/3600)%24), int(($uptime%3600)/60);
print "PC " . hostname . "\n";
exit 0;

sub dir_tree_size {
my $dir = shift;
my ($i,$total, $f);
$total = 0;
opendir DIR, $dir;
my @files = grep !/^\.\.?$/, readdir DIR;
for $i (@files) {
$f = "$dir/$i";
if(-d $f) {
$total += dir_tree_size($f) }
else {
$total += -s $f}
}
return $total;
}
|
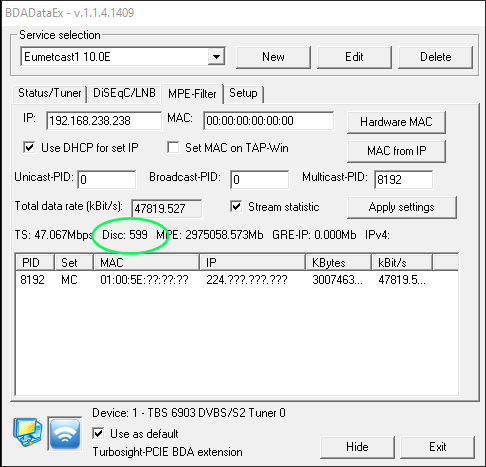
If you are using a TBS unit with the BDADataEx software it is possible to monitor some of the signal reception statistics, but this is not possible with the TBS IP Tool program. The author of the BDADataEx software - CrazyCat - has provided a program which allows monitoring of this software, and the program is called SignalEx.exe, and can be downloaded here (more recent copy here, and an older version here). It is rather like my own software for the DVB World boxes. The Google English translation of the page is here. The SignalEx.exe program needs to be placed in your MRTG bin directory. My thanks to CrazyCat for making the SignalEx and BDADataEx programs available.
My settings for the BDADataEx software are here.
My own tests are still at an early stage, and it appears that the only parameters I can currently monitor with the TBS5925 I have under test are the "strength" and "quality" percentage parameters, which are not in any sort of absolute units but may provide a useful indication of trends. The required include files follow, for a PC named "Stamsund" or "Lund". You will want to add one or more of these include lines to your mrtg.cfg master. Fortunately, "Crazy Cat" has managed to extract some more meaningful values in dB & dBm for those using his BDADataEx software (rather than the TBS software which crashes a number of Windows PCs). Examples using that facility are given below.
# Files for monitoring a BDADataEx installation # These work for a TBS5925 and TBS6903 Include: stamsund-dvbdataex.inc Include: stamsund-dvbdataex-rflevel.inc Include: stamsund-dvbdataex-snr.inc Include: stamsund-dvbdataex-ber.inc |
# File: stamsund-dvbdataex.inc #--------------------------------------------------------------- # DVBDataEx receiver signal level #--------------------------------------------------------------- Target[stamsund-dvbdataex-level]: `signalex.exe level` MaxBytes[stamsund-dvbdataex-level]: 100 Title[stamsund-dvbdataex-level]: DVBDataEx Signal Strength Options[stamsund-dvbdataex-level]: integer, gauge, nopercent, growright, unknaszero, noo ShortLegend[stamsund-dvbdataex-level]: % YLegend[stamsund-dvbdataex-level]: Strength % LegendI[stamsund-dvbdataex-level]: Strength: Legend1[stamsund-dvbdataex-level]: Strength (percent) PageTop[stamsund-dvbdataex-level]: <H1>DVBDataEx - Signal Strength</H1> #--------------------------------------------------------------- # DVBDataEx receiver signal quality #--------------------------------------------------------------- Target[stamsund-dvbdataex-quality]: `signalex.exe quality` MaxBytes[stamsund-dvbdataex-quality]: 100 Title[stamsund-dvbdataex-quality]: DVBDataEx Signal Quality Options[stamsund-dvbdataex-quality]: integer, gauge, nopercent, growright, unknaszero, noo ShortLegend[stamsund-dvbdataex-quality]: % YLegend[stamsund-dvbdataex-quality]: Quality % LegendI[stamsund-dvbdataex-quality]: Quality: Legend1[stamsund-dvbdataex-quality]: Quality (percent) PageTop[stamsund-dvbdataex-quality]: <H1>DVBDataEx - Signal Quality</H1> #--------------------------------------------------------------- |
This example data is from PC Lund:
# File: lund-bdadataex.inc #--------------------------------------------------------------- # BDADataEx receiver signal level #--------------------------------------------------------------- Target[lund-bdadataex-rflevel]: `signalex.exe rflevel` * -1 MaxBytes[lund-bdadataex-rflevel]: 150 Title[lund-bdadataex-rflevel]: 10E 11263H Signal RF level Options[lund-bdadataex-rflevel]: gauge, nopercent, growright, unknaszero, noo ShortLegend[lund-bdadataex-rflevel]: dBm YTicsFactor[lund-bdadataex-rflevel]: -1 Factor[lund-bdadataex-rflevel]: -1 YLegend[lund-bdadataex-rflevel]: Level: dBm LegendI[lund-bdadataex-rflevel]: Level: Legend1[lund-bdadataex-rflevel]: Level below 0 dBm. A lower plotted value means a bigger signal! PageTop[lund-bdadataex-rflevel]: <H1>10E 11263H Signal RF level</H1><br>Lower value means greater signal!<br> #--------------------------------------------------------------- # BDADataEx receiver signal snr #--------------------------------------------------------------- Target[lund-bdadataex-snr]: `signalex.exe snr` MaxBytes[lund-bdadataex-snr]: 180 YTics[lund-bdadataex-snr]: 6 YTicsFactor[lund-bdadataex-snr]: 0.1 Factor[lund-bdadataex-snr]: 0.1 Unscaled[lund-bdadataex-snr]: ymwd Title[lund-bdadataex-snr]: 10E 11263H Es/No Options[lund-bdadataex-snr]: gauge, nopercent, growright, unknaszero, noo ShortLegend[lund-bdadataex-snr]: dB YLegend[lund-bdadataex-snr]: Es/No: dB LegendI[lund-bdadataex-snr]: Es/No: Legend1[lund-bdadataex-snr]: Received Es/No (signal-to-noise ratio) PageTop[lund-bdadataex-snr]: <H1>10E 11263H - Es/No (Edinburgh)</H1> #--------------------------------------------------------------- # BDADataEx receiver signal ber #--------------------------------------------------------------- Target[lund-bdadataex-ber]: `signalex.exe ber` MaxBytes[lund-bdadataex-ber]: 10000000 YTicsFactor[lund-bdadataex-ber]: 0.1 Title[lund-bdadataex-ber]: 10E 11263H BER Options[lund-bdadataex-ber]: noo, gauge, nopercent, growright, logscale, withzeroes, unknaszero ShortLegend[lund-bdadataex-ber]: E-7 YLegend[lund-bdadataex-ber]: BER E-7 LegendI[lund-bdadataex-ber]: BER: Legend1[lund-bdadataex-ber]: Demodulator Bit Error Rate - BER * 10E-7 PageTop[lund-bdadataex-ber]: <H1>10E 11263H BER (Edinburgh)</H1> #--------------------------------------------------------------- |
The eagle-eyed amongst you may have spotted a "Disc" count on
the MPE-Filter tab. This may refer to discontinuities at the DVB/MPE
packet level, and it not currently monitored by MRTG. Ernst Lobsiger
writes his understanding:
The "Disc" counter of BDADataex might count "Discontinuities = Continuity Errors". This is on the MPE = 188 Bytes per packet level. MPE packets carry PID and a counter (for that PID). This counter will normally count up (and wrap). For example, after packet 7 of PID 300 packet 8 of PID 300 is expected. If then packet 11 arrives, this is a "Continuity Error". Then MPE packets are assembled per PID to IP packets (around 1200 Bytes). This is basically how the Transport Stream (TS) is "demultiplexed".
Hardware does FEC on MPE level, TelliCast has its own FEC on IP level. TelliCast counts missed/recovered IP packets. I have seen few MPE errors but lots of missed IP packets on transponder T2 with my TBS-6983 V13 under GNU/Linux.
FEC Forward Error Correction PID Packet Identifier IP Internet Protocol TS Transport Stream MPE Multi Protocol Encapsulation T2 Transponder2 for EUMETCast
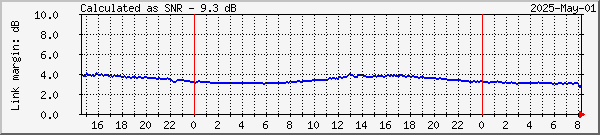
Simply use the SNR and subtract 9.3 dB to get the link margin for the High Volume Service (HVS-1 or HVS-2). Here's an example for the single-cable, dual tuner arrangement for the TBS 6903 etc.
#--------------------------------------------------------------- # BDADataEx receiver link-margin => SNR -9.3 dB #--------------------------------------------------------------- Target[lund-bdadataex-lm]: `signalex.exe snr 1` - 93 MaxBytes[lund-bdadataex-lm]: 100 YTics[lund-bdadataex-lm]: 5 YTicsFactor[lund-bdadataex-lm]: 0.1 Factor[lund-bdadataex-lm]: 0.1 Unscaled[lund-bdadataex-lm]: ymwd Options[lund-bdadataex-lm]: gauge, nopercent, growright, unknaszero, noi, nolegend ShortLegend[lund-bdadataex-lm]: dB YLegend[lund-bdadataex-lm]: Link margin: dB LegendO[lund-bdadataex-lm]: High volume service 1: Legend1[lund-bdadataex-lm]: Calculated HVS link margin PNGTitle[lund-bdadataex-lm]: Calculated as SNR - 9.3 dB Title[lund-bdadataex-lm]: 10E 11263H HVS-1 calculated link margin PageTop[lund-bdadataex-lm]: <H1>10E 11263H - Calculated Link Margin (Edinburgh)</H1> #--------------------------------------------------------------- # BDADataEx receiver link-margin => SNR -9.3 dB #--------------------------------------------------------------- Target[lund-1-bdadataex-lm]: `signalex.exe snr` - 93 MaxBytes[lund-1-bdadataex-lm]: 100 YTics[lund-1-bdadataex-lm]: 5 YTicsFactor[lund-1-bdadataex-lm]: 0.1 Factor[lund-1-bdadataex-lm]: 0.1 Unscaled[lund-1-bdadataex-lm]: ymwd Options[lund-1-bdadataex-lm]: gauge, nopercent, growright, unknaszero, noi, nolegend ShortLegend[lund-1-bdadataex-lm]: dB YLegend[lund-1-bdadataex-lm]: Link margin: dB LegendO[lund-1-bdadataex-lm]: High volume service 2: Legend1[lund-1-bdadataex-lm]: Calculated HVS link margin PNGTitle[lund-1-bdadataex-lm]: Calculated as SNR - 9.3 dB Title[lund-1-bdadataex-lm]: 10E 11387H HVS-2 calculated link margin PageTop[lund-1-bdadataex-lm]: <H1>10E 11387H - Calculated Link Margin (Edinburgh)</H1> #--------------------------------------------------------------- |
... and the resulting plots. Note that HVS-2 will be slightly lower than HVS-1 due to transponder characteristics, and that if the HVS-1 margin looks to be greater at weekends than during the week it could be that the skew on your LNB isn't correctly set and that you are seeing a little of the weekday cross-polarised signal. Don't the single lines look clearer than the green blocks! Click on a graph to see the usual day/week/month/year set.
HVS-1
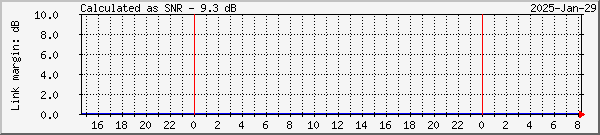
HVS-2
Information kindly provided by Thorsten Miglus in Germany.
I have written a script to retrieve the SNR for use with MRTG. You can publish this on your Web Page. With the script cmcs.exe is used available on the Novra Web Page. Users have to set the cmcs path, ip address and password of their receiver.
Filename: snr.cmd
@echo off cls set cmcspath=C:\Tools\novra\cmcs set ip=192.168.3.100 set password=Novra-S2 set tmppath=%temp% set cmcslog=%tmppath%\cmcs.log %cmcspath%\cmcs -ip %ip% -pw %password% -csv1status %cmcslog% >NUL 2>NUL for /F "tokens=11 delims=," %%i in (%cmcslog%) do set snr=%%i del %cmcslog% set point=%snr:~1,1% if %point% == . (set snr=%snr:~0,1%%snr:~2,1%) else (set snr=%snr:~0,2%%snr:~3,1%) echo %snr% echo 0 |
Then use this include file with mrtg.cfg:
#--------------------------------------------------------------- # S300N - receiver Es/No #--------------------------------------------------------------- Target[snr]: `snr.cmd` MaxBytes[snr]: 18 0 YTics[snr]: 6 YTicsFactor[snr]: 0.1 Factor[snr]: 0.1 Unscaled[snr]: dwmy Title[snr]: Novra S300N Es/No Options[snr]: gauge, nopercent, growright, unknaszero, noo ShortLegend[snr]: dB YLegend[snr]: Es/No: dB LegendI[snr]: Es/No: Legend1[snr]: Received Es/No (signal-to-noise ratio) PageTop[snr]: <H1>Novra S300N - Es/No (Naila)</H1> #--------------------------------------------------------------- |
There are two different models of the S300 being used for EUMETCast
reception, and the difference between Novra S300N and Novra S300E
seems to be more than just marketing and price tag :-). They output the
SNR data at two different offsets in the string:
You will now see why I put the HTML and Images into the same separate directory - they are all the files you need to upload to your Web server! You can alter those directories without losing any log files when you restart MRTG. I actually use WS_FTP Pro for uploading as it allows me just to upload changed files, but the supplied Windows FTP command will work as does MoveItFreely (which is perhaps a little more reliable). You might need to add FTP Client to Windows using the Control Panel, Add Windows Features method. You may also need to see whether Passive or Active FTP works best for you.
http://www.ipswitchft.co.uk/moveit-managed-file-transfer/file-transfer/clients/moveit-freely
Other programs recommended on the basis of experience actually using them include:
I schedule a batch file to run every 15 minutes. Here is a sample batch file for MoveItFreely named e.g. upload-mrtg.cmd:
REM  Change directory to where the files for uploading live
PUSHD C:\Tools\mrtg\html
REM Perform the upload C:\Tools\MoveItFreely\FTPs -n -s:C:Tools\MoveItFreely\upload.ftp REM Back to our original directory POPD EXIT |
The "-n" stops the program from asking for user-name and password every time. The "-s:<filename>" says where the commands are to be read from. Sample FTP commands file - C:\Tools\MoveItFreely\upload.ftp - you will need to customise this for your particular Web server.
open ftp.your-web-server.com user <user> <pass> cd /htdocs/mrtg/ lcd \Tools\mrtg\html prompt type ascii mput *.html type binary mput *.png quit |
You can use the Task Scheduler to run the upload-mrtg.cmd file every 15 minutes. I see I have also played with wput - can't recall whether it was any better or worse!
|
|