|
| |
Using MRTG to monitor NTP
I suggest first installing MRTG and become familiar with how
to install and configure it on your own system. You can then add to the
MRTG configuration to include timekeeping monitoring and a whole lot more.
The following commands would typically live in your C:\mrtg\bin\ directory.
I have also used MRTG for computer
performance measurement, and for a satellite data service signal
level and error rate monitoring.
The rest of this note is written assuming you have MRTG
installed and working correctly. It describes how to extract the data NTP
can report (even from remote clients) into a form which MRTG can use, and offers
some plotting suggestions. Finally, a couple of other monitoring
alternatives are mentioned.
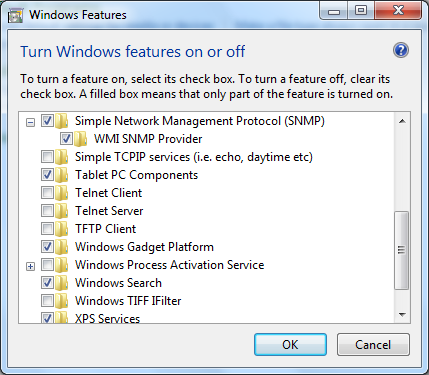
There are a couple of steps which are needed on Windows Vista
and Windows-7 & 8 which may not be needed on earlier versions of Windows.
This is because SNMP service which may not be needed by many users is not installed
by default, so first you must add that Windows feature, and then configure the security settings
for the SNMP service.
Control Panel, Programs, Turn
Windows Features on and off
- Add the Windows SNMP component (in the Management and
Monitoring tools)
|
|
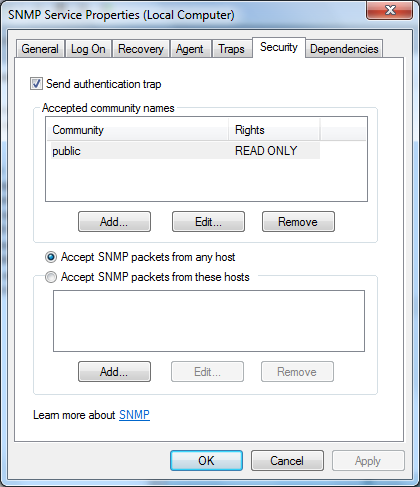
Administrative Tools, Services,
SNMP Service, right-click, Properties, Security tab
- Add read-only access to the SNMP data for the "public"
community
- Allow access to the SNMP data from any host
address (or at least 127.0.0.1)
|
 |
|
 |
These steps are also described here.
Likely you will also need to add ntpd.exe to the Windows
Firewall, to allow it to accept incoming connections.
Using fixed scaling and bipolar display
Version for Internet-synced sources, displays +/- 100 ms
An offset of +/- 100 milliseconds should be within the range
of most devices when synced to Internet sources. You may well do
better! As MRTG cannot plot negative numbers, I choose to plot the offset
plus a bias, with a fixed scaling which makes the zero offset line in the middle
of the graph. You need a command-line program to extract the output from an
NTP query command "ntpq -c rv". As MRTG requires Perl, I wrote this
simple program in Perl as
well:
| File: GetNTP.pl |
$ntp_str = `ntpq -c rv $ARGV[0]`;
$val = (split(/\,/,$ntp_str))[20];
$val =~ s/offset=//i;
$val = int ($val + 100);
if ($val < 0) {
  $val = 0;
}
print "0\n";
print "$val\n";
print "0\n";
print "0\n";
|
To test whether this is working, get a command prompt, CD to
your MRTG bin directory (e.g. C:\mrtg\bin\), and enter the command:
perl GetNTP.pl pc-name
pc-name can be this PC, or another one on your network.
You would expect to get back a four-line response, where "109" is the
offset plus 100 milliseconds in the example below:
0
109
0
0
Here's a sample of the output, although this PC keeps rather
more accurate time than the +/- 100 ms scale shows. You can click on the
graph to see the four time periods which MRTG normally displays:
Here is a sample of the output with +/- 3ms scale, click on
the graph for more
examples:
IPv6 note
If you are running version 4.2.4 or earlier of ntp, and you
have Windows Vista, Windows-7/8 or later installed, it's possible that you have
both IPv4 and IPv6 working on your network. The IPv6 is started
automatically on these later operating systems. I found that under these
circumstances, using the ntpq <local-pc-name> didn't work, possibly
because the ntpd wasn't binding to both the IPv4 and IPv6 addresses (this is
still under investigation). To get this to work properly, I found that you
could either:
- use the IPv4 numeric address in the mrtg.cfg Target line
- add an entry to \etc\hosts for the PC such as:
192.168.0.5 pc-name
For the local PC, use the form:
Target[odin_ntp]: `perl GetNTP.pl 127.0.0.1`
Adding a "zero" line in the middle of the graph
By making the MaxBytes and MaxBytes2 values different, you can get MaxBytes
plotted as a red dotted line on the graph, nicely indicating the nominal value if you make MaxBytes half MaxBytes2.
So for a 100ms offset from zero
for example, you could change the lines as shown below.
| Extract from mrtg.cfg |
Target[odin_ntp]: `perl GetNTP.pl odin`
MaxBytes[odin_ntp]: 100
MaxBytes2[odin_ntp]: 200
Unscaled[odin_ntp]: dwmy
Timezone[odin_ntp]: GMT
Title[odin_ntp]: NTP statistics for Odin - offset from NTP
Options[odin_ntp]: integer, gauge, nopercent, growright
YLegend[odin_ntp]: offset+100 ms
ShortLegend[odin_ntp]: ms
LegendI[odin_ntp]:
LegendO[odin_ntp]: offset:
Legend1[odin_ntp]: n/a
Legend2[odin_ntp]: time offset in ms, with 100ms offset added to ensure it's positive!
PageTop[odin_ntp]: <H1>NTP -- PC Odin</H1>
|
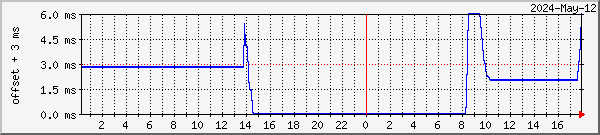
With Windows PCs synced from a local stratum-1 reference
clock, a range of +/-3 milliseconds is more appropriate than +/- 100
milliseconds. A different Perl script is required to extract the offset
data. One oddity here is that when specifying 6000 (µs)
as the maximum value for the graph, MRTG seemed to set a value slightly greater
than the 6ms I wanted, so I had to set the maximum to 5990. This had the
unfortunate effect that when the offset exceeded 6000, the last value less than
6000 was plotted, rather than the 6000 limit. Hence I changed the Perl
script to limit the positive value it returned to 5985 in an attempt to ensure
that values over the limit are displayed as such.
|
File: GetNTP3000usec.pl
(for NTP alone) |
|
File: GetNTP3000usec-b.pl
(for both NTP and NTPsec) |
#  Earlier version using explicit string index
#
$ntp_str = `ntpq -c rv $ARGV[0]`;
$val = (split(/\,/,$ntp_str))[20];
$val =~ s/offset=//i;
$val = 1000.0 * $val;    # convert to microseconds
$report = int ($val + 3000);
# limit negative value to 0
if ($report < 0) {
  $report = 0;
}
# limit positive value to just under 6000
if ($report > 5985) {
  $report = 5985;
}
print "0\n";
print "$report\n";
print "0\n";
print "$ARGV[0]\n";
|
|
# This version locates the offset string in the response

$response = `ntpq -c rv $ARGV[0]`;
$loc = index ($response, "offset=");
$offset = substr ($response, $loc+7);
$loc = index ($offset, ",");
substr ($offset, $loc, 999) = "";
$offset = 1000.0 * $offset;	# convert to microseconds
$report = int ($offset + 3000);	#  -3000..+3000 microseconds => 0..6000
if ($report < 0) {
  $report = 0;
}
if ($report > 5985) {
  $report = 5985;
}
print "0\n";
print "$report\n";
print "0\n";
print "0\n";
|
Note the MaxBytes and MaxBytes2 values below, for a +/-3ms offset from zero
as shown below:
| File: narvik-ntp-b.inc |
#---------------------------------------------------------------
#	PC Narvik - timekeeping
#---------------------------------------------------------------

Target[narvik_ntp-b]: `perl GetNTP3000usec.pl narvik`
MaxBytes[narvik_ntp-b]: 5990
MaxBytes2[narvik_ntp-b]: 3000
Unscaled[narvik_ntp-b]: dwmy
Title[narvik_ntp-b]: NTP statistics for Narvik - offset from UTC
Options[narvik_ntp-b]: integer, gauge, nopercent, growright
YLegend[narvik_ntp-b]: offset + 3ms
kMG[narvik_ntp-b]: ,ms,,,,
ShortLegend[narvik_ntp-b]: µs
LegendI[narvik_ntp-b]:
LegendO[narvik_ntp-b]: offset + 3000µs:
Legend1[narvik_ntp-b]: n/a
Legend2[narvik_ntp-b]: time offset in µs, with 3000µs offset added to ensure it's positive.
PageTop[narvik_ntp-b]: <H1>NTP -- PC Narvik</H1>
|
Here is a sample of the output, click on the graph for more
examples:

Version for ref-clock sources, displays +/- 20 µs.
In February 2006, I added a simple stratum 1 server, and added a different version
of the Perl script to cover the more limited range of +/-20 microseconds (displayed as
0..40 µs). By July 2006, the GPS was failing more often (tree leaf
growth?), so I modified the script to limit on both positive and negative excursions (as without the GPS the server could be hundreds of microseconds
out).
| File: GetNTP20microseconds.pl |
$ntp_str = `ntpq -c rv $ARGV[0]`;
$val = (split(/\,/,$ntp_str))[20];
$val =~ s/offset=//i;
$val = 1000.0 * $val;        # convert to microseconds
$report = int ($val + 20);
if ($report < 0) {
  $report = 0;
}
if ($report > 40) {
  $report = 40;
}
print "0\n";
print "$report\n";
print "0\n";
print "0\n";
|
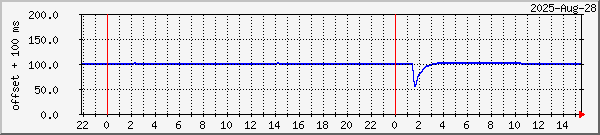
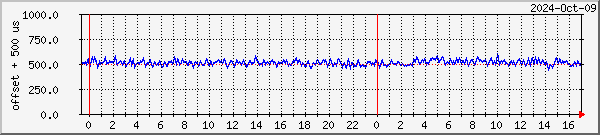
This script was later modified for rather less accurate
Windows-based ref-clock systems, so that an offset swing of +/- 500 µs could be
displayed on a scale of 0..1000 µs.
| File: GetNTP500microseconds.pl |
$ntp_str = `ntpq -c rv $ARGV[0]`;
$val = (split(/\,/,$ntp_str))[20];
$val =~ s/offset=//i;
$val = 1000.0 * $val;           # convert to microseconds
$report = int ($val + 500);     #  -500..+500 microseconds => 0..1000
if ($report < 0) {
  $report = 0;
}
if ($report > 1000) {
  $report = 1000;
}
print "0\n";
print "$report\n";
print "0\n";
print "0\n";
|
Here's a sample of the output:
Recording Jitter
This Perl script and MRTG configuration allows monitoring of
the jitter directly. As before, the Perl script uses the "ntpq -crv"
command, and parses it to produce the four lines required by MRTG.
| File: GetNTPjitterNano.pl |
$ntp_str = `ntpq -c rv $ARGV[0]`;

$val = (split(/\,/,$ntp_str))[22];
$val =~ s/sys_jitter=//i;
$val = 1000000.0 * $val;	# convert to nanoseconds
$sys_jitter = int ($val);

$val = (split(/\,/,$ntp_str))[23];
$val =~ s/clk_jitter=//i;
$val = 1000000.0 * $val;	# convert to nanoseconds
$clk_jitter = int ($val);

print "$clk_jitter\n";
print "$sys_jitter\n";
print "0\n";
print "0\n";
|
This is the corresponding MRTG configuration file.
| Partial sample file: offsets.inc |
#---------------------------------------------------------------
# RasPi-23 - NTP jitter
#---------------------------------------------------------------
Target[raspi-23-ntp-jitter]: `perl GetNTPjitterNano.pl raspi-23`
MaxBytes[raspi-23-ntp-jitter]: 1000000000
Title[raspi-23-ntp-jitter]: NTP jitter for RasPi-23
Options[raspi-23-ntp-jitter]: integer, gauge, nopercent, growright
YLegend[raspi-23-ntp-jitter]: jitter
ShortLegend[raspi-23-ntp-jitter]:
kMG[raspi-23-ntp-jitter]: ns,us,ms,s,
LegendI[raspi-23-ntp-jitter]: clk_jitter:
LegendO[raspi-23-ntp-jitter]: sys_jitter:
Legend1[raspi-23-ntp-jitter]: clk_jitter
Legend2[raspi-23-ntp-jitter]: sys_jitter
PageTop[raspi-23-ntp-jitter]: <H1>NTP jitter -- PC RasPi-23</H1>
#---------------------------------------------------------------
# PC Lund - NTP jitter
#---------------------------------------------------------------
Target[lund-ntp-jitter]: `perl GetNTPjitterNano.pl lund`
MaxBytes[lund-ntp-jitter]: 1000000000
Title[lund-ntp-jitter]: NTP jitter for Lund
Options[lund-ntp-jitter]: integer, gauge, nopercent, growright
YLegend[lund-ntp-jitter]: jitter
ShortLegend[lund-ntp-jitter]:
kMG[lund-ntp-jitter]: ns,us,ms,s,
LegendI[lund-ntp-jitter]: clk_jitter:
LegendO[lund-ntp-jitter]: sys_jitter:
Legend1[lund-ntp-jitter]: clk_jitter
Legend2[lund-ntp-jitter]: sys_jitter
PageTop[lund-ntp-jitter]: <H1>NTP jitter -- PC Lund</H1>
#---------------------------------------------------------------
|
and here's a .PHP HTML file you could use to display the
results.
| Partial sample file: offsets.php |
<?php
if (!isset($_GET['period'])) {
  $period = "day"; // Default period
} else {
  $period = $_GET['period'];
}
$raspi23_jitter_image = "raspi-23-ntp-jitter-".$period.".png";
$lund_jitter_image = "lund-ntp-jitter-".$period.".png";
?>

<table border="0" cellpadding="0" cellspacing="5">
  <tr>
    <td valign="middle" align="center"><a href="raspi-23-ntp-jitter.html">
      <img border="0" src="<?php echo $raspi23_jitter_image; ?>" width="600" height="135"></a></td>
    <td valign="middle" align="center"><font size="2"><a href="performance_raspi-23.php">RPi #23</a><br>
      Raspberry Pi 4B, 4 GB<br>
      Buster 5.4.42-v8+ #1319 [64bit]<br>
      PPS from GPS module<br>
      <font color="#008000">Clock</font> & <font color="#0000C0">System</font> jitter<br>
    </font></td>
  </tr>

  <tr>
    <td valign="middle" align="center"><a href="lund-ntp-jitter.html">
      <img border="0" src="<?php echo $lund_jitter_image; ?>" width="600" height="135"></a></td>
    <td valign="middle" align="center"><font size="2"><a href="performance_lund.php">Lund</a><br>
      Windows-10/64 PC<br>
      Intel i5-6400 16 GB, 2.70 GHz<br>
      PPS over add-in COM port<br>
      <font color="#008000">Clock</font> & <font color="#0000C0">System</font> jitter<br>
    </font></td>
  </tr>
</table>
|
The full results I have are displayed
here.
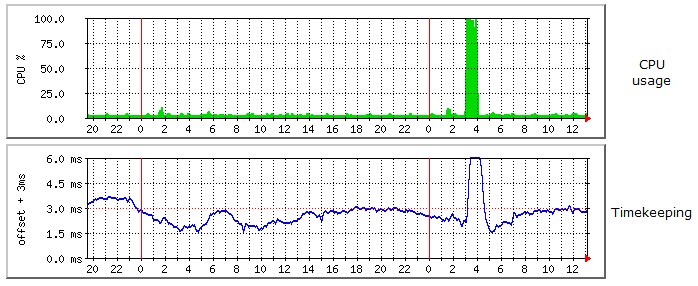
Here's an interesting result - a PC which is normally fairly
lightly loaded runs a particular job once a week. During the job, the CPU
is used intensively, and jumps up from a few percent to almost 100% usage.
CPU gets hot, warms the interior of the PC and hence the clock crystal, so NTP
starts to compensate for the warming by changing the system clock divider.
While the rate is changing to accommodate the new crystal frequency, there is an
offset as a result. This quite neatly captured in the graphs below.
Note that the offset may exceed 3.0 milliseconds - it's clipped for presentation
purposes.
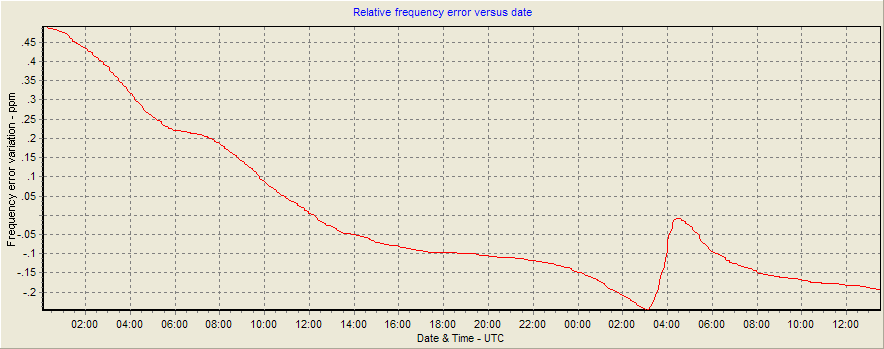
.. and here's another view from my NTP
Plotter program showing show offset is related to the rate of change of frequency,
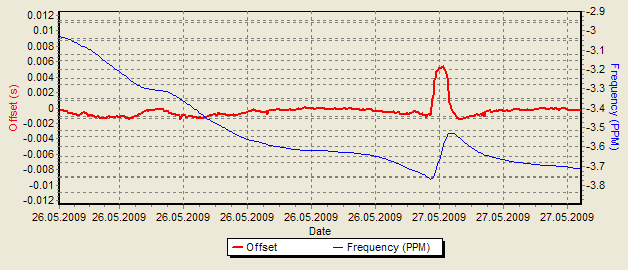
.. and another view, this time from the Meinberg
NTP Time Server Monitor program:
New method with automatic scaling
An alternative first
suggested by John Say is to plot positive and negative offsets as two separate
graphs. Although John didn't use this, it would allow automatic scaling
rather than the fixed scaling of the earlier approach. I have based the
suggested Perl script and MRTG configuration file on John's approach, and I'm
using microseconds rather than milliseconds as it suits my systems better
(although the prospect of seeing kµsec rather than milliseconds is rather offensive!)
These files are my first attempt, and will likely be revised in the light of
experience.
| File: GetNTPoffset.pl |
# Expects node name as a parameter
# Returns 1st value for positive offsets, second value for negative
# Returns microseconds of offset
$ntp_str = `ntpq -c rv $ARGV[0]`;       # execute "ntpq -c rv <node>"
$val = (split(/\,/,$ntp_str))[20];      # get the offset string
$val =~ s/offset=//i;                   # remove the "offset="
$val = int (1000 * $val);               # convert to microseconds
$nval = $val;                           # prepare the negative value
if ($val < 0){
$nval = -$nval;                         # make the value positive
$val = 0;                               # ensure zero return for the positive
} else {
$nval = 0;                              # ensure zero return for the negative
}
print "$nval\n";                        # return four numbers, incoming
print "$val\n";                         # outgoing
print "0\n";
print "$ARGV[0]\n";
|
| File: narvik-ntp-p.inc |
#---------------------------------------------------------------
#	PC Narvik - timekeeping
#---------------------------------------------------------------

Target[narvik_ntp-p]: `perl GetNTPoffset.pl narvik`
MaxBytes[narvik_ntp-p]: 100000
Title[narvik_ntp-p]: NTP statistics for Narvik - offset from UTC
Options[narvik_ntp-p]: integer, gauge, nopercent, growright
Colours[narvik_ntp-p]: BLUE#0033FF, RED#FF0000, BLUE#0033FF, RED#FF0000,
YLegend[narvik_ntp-p]: offset +/- us
ShortLegend[narvik_ntp-p]: µs
LegendI[narvik_ntp-p]: offset µs (-):
LegendO[narvik_ntp-p]: offset µs (+):
Legend1[narvik_ntp-p]: Time offset in µs (-)
Legend2[narvik_ntp-p]: Time offset in µs (+)
PageTop[narvik_ntp-p]: <H1>NTP -- PC Narvik</H1>
|
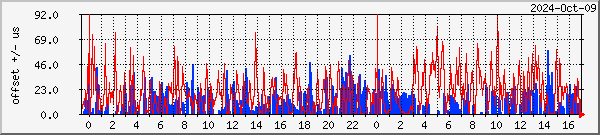
Here is a sample of this format of output:
Earlier Information - where it all started
Here is my earlier information on the topic - a
text file. |