Used
Free
usage
| Harstad | Kiruna | Lund | Oslo | Penguin | RPi 1 3 4 5 8 9 10 11 12 13 14 15 16 17 18 19 20 21 22 23 24 25 28 29 30 | Pixie | Condor | Drammen | Floro | Ystad | Web srv | |||
| WAN | Network | Timekeeping | CPU/mem | EUMETCast Europe | DVB-S2 | Ecast I/O | Losses | HVS losses | RAMdisk | T1/T2 | Air °C | ADS-B | GPS | DOP | SNR | NTP jitter | How-to | |
Information here covers memory & CPU loading, hard disk temperatures, and Cable Modem monitoring. I have also used MRTG for monitoring signal levels and error rates on the EUMETCast satellite data service, for monitoring timekeeping using NTP, and for monitoring atnospheric pressure with a JeeNode Arduino-like board. File here: GetBarometer.zip. You may first need to install and enable the Windows SNMP component. Performance and other monitoring for the Raspberry Pi is described here, and for the Ayecka SR 1 DVB-S2 receiver running EUMETCast here.
I use .php Web pages for the data summaries so that I can use one page for the day, week, month and year data, simply by using a single query parameter "period", so the references become page?period=day, page?period=week and so forth. To explain this further, I have made one of the .php pages available as a text document here.
NOTE: Under Windows-10, 1809 and later, the required SNMP Windows component is not installed by default. A Google search produced:
Open the Settings on your Windows machine.
Click Apps.
Choose Manage optional features under Apps & features.
Click Add a feature.
Select Simple Network Management Protocol (SNMP) from the list.
Click Install to enable SNMP on your computer.
Sections included here:
Once you have installed: SNMP Informant on each PC you wish to monitor, you can access the data directly from MRTG, as it has a specific SNMP object ID (OID), so the script fragments are as shown below. To keep the configuration file clean, I actually used include statements in the mrtg.cfg file, such as:
Include: narvik-monitor.inc
As PC Narvik has two CPUs, there are two instances 48 and 49 listed in the [Target] line in the sample below.
|
Contents of narvik-monitor.inc |
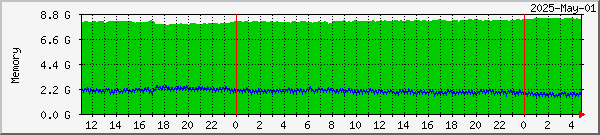
#---------------------------------------------------------------
# PC Narvik - Memory
#---------------------------------------------------------------

Target[Narvik-mem]: 1.3.6.1.4.1.9600.1.1.2.19.0&1.3.6.1.4.1.9600.1.1.2.2.0:public@127.0.0.1 * 1024
MaxBytes[Narvik-mem]: 8000000000
Options[Narvik-mem]: integer, gauge, nopercent, growright, unknaszero
YLegend[Narvik-mem]: Memory
ShortLegend[Narvik-mem]: B
LegendI[Narvik-mem]: Used
LegendO[Narvik-mem]: Avail
Legend1[Narvik-mem]: Memory committed
Legend2[Narvik-mem]: Memory available
Title[Narvik-mem]: Narvik Memory
PageTop[Narvik-mem]: <H2>PC Narvik - Memory</H2>

#---------------------------------------------------------------
# PC Narvik - CPU load, dual-core CPU
#---------------------------------------------------------------

Target[Narvik-CPU]: 1.3.6.1.4.1.9600.1.1.5.1.5.1.48&1.3.6.1.4.1.9600.1.1.5.1.5.1.49:public@127.0.0.1
MaxBytes[Narvik-CPU]: 100
YLegend[Narvik-CPU]: CPU %
ShortLegend[Narvik-CPU]: %
LegendI[Narvik-CPU]: CPU 1
LegendO[Narvik-CPU]: CPU 2
Legend1[Narvik-CPU]: CPU 1 usage
Legend2[Narvik-CPU]: CPU 2 usage
Options[Narvik-CPU]: integer, gauge, nopercent, growright, unknaszero
Title[Narvik-CPU]: Narvik CPU
PageTop[Narvik-CPU]: <H2>PC Narvik - CPU load</H2>
# If PC Narvik were a single-core CPU, use two instances of object 48, as MRTG requires that # you have two variables returned. You may also want to prevent display of the second output # line by adding the "no-ouput" option (noo) to the Options line: Target[Narvik-CPU]: 1.3.6.1.4.1.9600.1.1.5.1.5.1.48&1.3.6.1.4.1.9600.1.1.5.1.5.1.48:public@127.0.0.1 Options[Narvik-CPU]: integer, gauge, nopercent, growright, noo # I found that on a lower-spec PC (Bacchus), returning the CPU twice caused an artificially # high value to be returned for the second call (presumably the CPU busy processing the first # request?!), so I actually changed to using the SNMP value: Maximum Number of Process Contexts # i.e. .1.3.6.1.2.1.25.1.7.0 (check this on your system using GetIF), which returns integer 0. Target[Bacchus-CPU]: 1.3.6.1.4.1.9600.1.1.5.1.5.1.48&1.3.6.1.2.1.25.1.7.0:public@127.0.0.1 |
As this is my first attempt, any suggestions for improvements are welcome.
The only thing noticeably different is using OIDs in the [Target] line, as described
here, and I used the GetIF program and the MIBs from SNMP Informant to work out
what to monitor. If GetIF doesn't work on your PC, you can try
iReasoning MIB Browser
instead (thanks to Mads Kristoffersen for that), There are a lot more parameters available from the free SNMP Informant.
I added the unknaszero option so that when the PC is offline, the zero CPU and
memory usage are clearly visible. If you are running MRTG on the PC which
is being monitored, then you don't need to specify the name name in the
Target line, you can use the loopback IP instead (127.0.0.1).
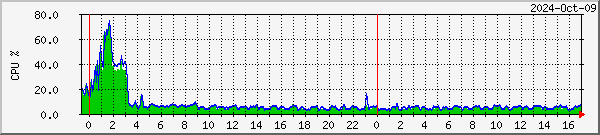
All running under Windows, Windows-XP to Windows-10! Here's some current data:
|
Memory Used Free |
|
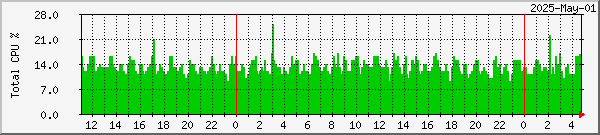
Total CPU usage |
With common systems now having up to 4 CPUs (well, dual-core plus hyperthreading), you may find
it more helpful to plot the total CPU usage as well as, or even in place of, the four individual
CPU graphs plotted on two separate graphs. SNMP Informant supports "_Total" as well as "0", "1",
"2" and "3" for the individual CPU OIDs. "_Total" is represented as the six-character,
counted ASCII string: 6.95.84.111.116.97.108 I have used the "localhost" IP address in the
example below, rather than the PC name, as you can re-use that string on any PC!
#---------------------------------------------------------------
#	PC Alta - total CPU load
#---------------------------------------------------------------

# Enter the following string all on one line.
Target[Alta-CPU-total]: 1.3.6.1.4.1.9600.1.1.5.1.5.6.95.84.111.116.97.108&
           1.3.6.1.4.1.9600.1.1.5.1.5.6.95.84.111.116.97.108:public@127.0.0.1
MaxBytes[Alta-CPU-total]: 100
YLegend[Alta-CPU-total]: Total CPU %
ShortLegend[Alta-CPU-total]: %
LegendI[Alta-CPU-total]: Total CPU
Legend1[Alta-CPU-total]: Total CPU usage
Options[Alta-CPU-total]: integer, gauge, nopercent, growright, unknaszero, noo
Title[Alta-CPU-total]: Alta Total CPU
PageTop[Alta-CPU-total]: <H2>PC Alta - Total CPU load</H2>
|
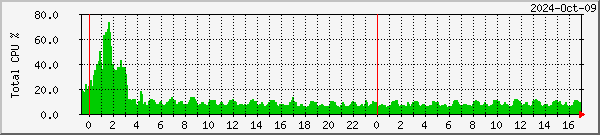
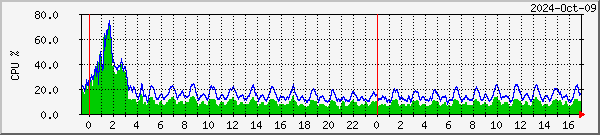
.. and here's an example comparing _Total with the four separate CPUs for PC Alta:
|
PC Alta Total CPU usage
|
 |
CPU 1 & 2 |
 |
CPU 3 & 4 |
As the amount of physical memory has increased, virtual memory may now exceed 4GB, as may the physical memory in the machine and that available for use. Consequently, I have revised the object IDs (OIDs) I use for memory from those which report in bytes to those which report in kilobytes, and I multiply the result obtained by 1024 to get the actual number in bytes. It seems that the OIDs which report in bytes are only 32-bit values, whereas MRTG can work with 64-bit integers. You can seen the change here.
Earlier call using byte OIDs:
Target[Molde-mem]: 1.3.6.1.4.1.9600.1.1.2.4.0&1.3.6.1.4.1.9600.1.1.2.1.0:public@127.0.0.1
Later call using kilobyte OIDs and multiplying the returned value:
Target[Molde-mem]: 1.3.6.1.4.1.9600.1.1.2.19.0&1.3.6.1.4.1.9600.1.1.2.2.0:public@127.0.0.1 * 1024Watch out for the MaxBytes value which you may need as well!
Windows since Windows 2000 has included basic performance monitoring counters which include a set for disk usage measurement. For each disk, there are at least three basic values available: disk size, disk used, and disk space units. Having the units specified separately means that to get the disk used in bytes you must multiply the disk-used by the disk-allocation-units. Fortunately, MRTG allows a target to be specified as A * B, so that's not a problem. What is slightly more of an issue is the variable number of disks, which means that as disks come and go on your system - even plugging in a USB memory stick, for example - the index in the table of disks of a particular drive may vary, at least if you have a RAMdisk or extra partition with a high drive-letter - T: or Z:, for example. I haven't discovered a way of fixing this so far, but that may just be my ignorance of using SNMP!
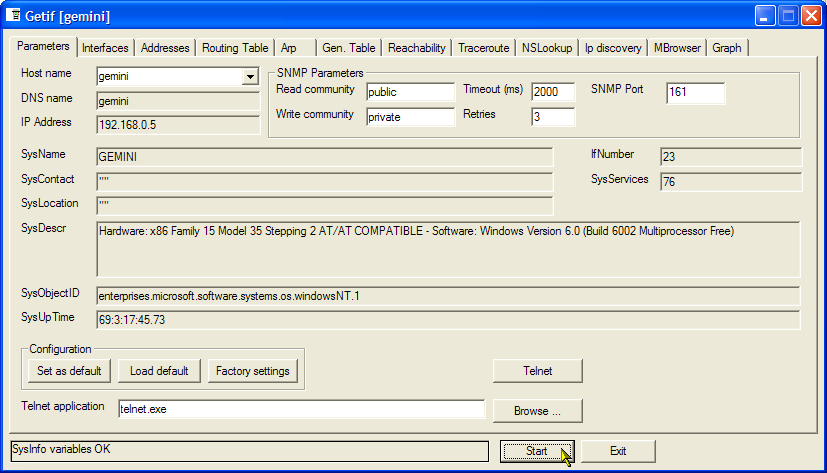
You need to "walk the MIB" for the PC in question. To do this, download a program such as GetIF version 2.3.1 or iReasoning MIB Browser which allows this. Having installed GetIF, open the program, enter the PC's name or IP address into the Host Name box, and press the Start button.
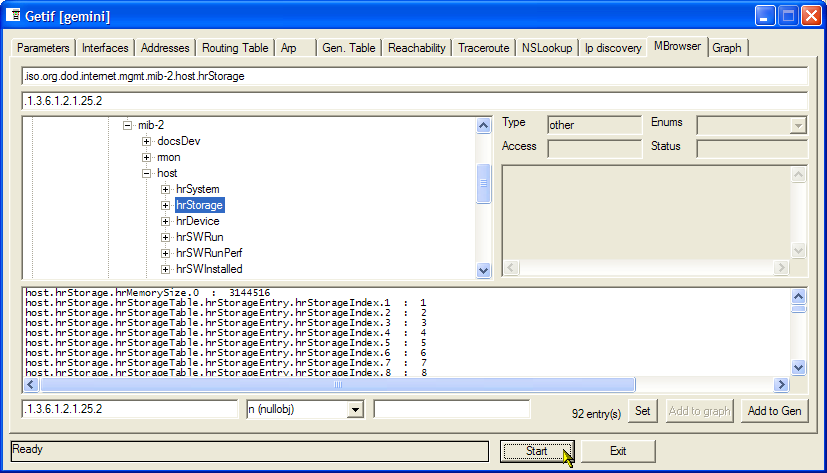
Now move to the MBrowser tab, and the string:
.iso.org.dod.internet.mgmt.mib-2.host.hrStorage
in the first box (to replace .iso), and press the Start button. You should see the list box window at the bottom populate with a set of values, 92 values in the example below:
You can now scroll down the list of values to find the index for the name of the monitored volume (drive T:) in this case. Click on the entry is the list, and its description and value will appear.
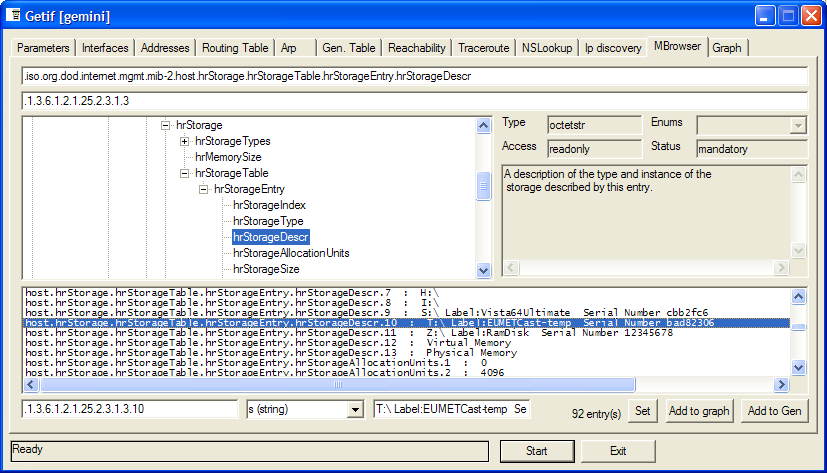
where the OID (object ID) is given in the last line as ".1.3.6.1.2.1.25.2.3.1.3.10", so the index is "10", and you can now scroll further down to find the corresponding allocation units (".1.3.6.1.2.1.25.2.3.1.4.10") and storage used (".1.3.6.1.2.1.25.2.3.1.6.10").
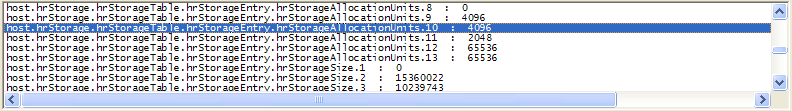
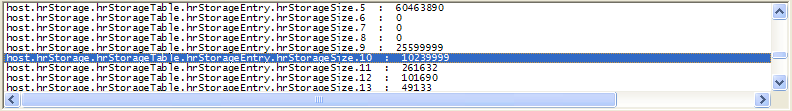
So the storage used in bytes is the product of the numbers returned from these two values (4096 * 33933 = 138989568 bytes, 133.55MB).
As MRTG requires two values to be returned by the Target string (at least I think it does....), you need to add a second OID so that two values are returned. I simply used a value which returns and integer on my system. I don't know whether you could just put a zero. Please tell me if you know better! So the Target is:
OID1 & OID2 * OID1 & OID2.
Please note that to stop the Web page becoming excessively wide, I have shown the Target line below as:
<A> *
<B>
whereas it should be written on a single line since MRTG doesn't allow continuation lines (as far as I know):
<A> * <B>
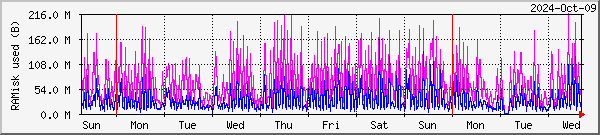
If the disk is mostly used for temporary storage such as a RAMdisk in EUMETCast use, you may want to know what the maximum use is so that you can size the RAMdisk appropriately. Remember that MRTG only takes snapshots every five minutes so you may not catch the peak, but MRTG can display (in magenta) the 5-minute peak values on the week, month and year graphs. Enable this by including the "WithPeak" line below.
|
Contents of alta-disk-used.inc |
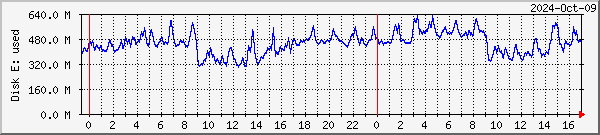
#--------------------------------------------------------------- # PC Alta - EUMETCast partition E: used #--------------------------------------------------------------- # Partition E: shows as index 3 on PC Alta # Note that the following should all be on ONE line, not split at the "*" Target[Alta-disk-E-used]: 1.3.6.1.2.1.25.1.7.0&.1.3.6.1.2.1.25.2.3.1.6.3:public@127.0.0.1 * 1.3.6.1.2.1.25.1.7.0&.1.3.6.1.2.1.25.2.3.1.4.3:public@127.0.0.1 MaxBytes[Alta-disk-E-used]: 32000000000 Options[Alta-disk-E-used]: integer, gauge, nopercent, growright, unknaszero, noi YLegend[Alta-disk-E-used]: Disk E: used ShortLegend[Alta-disk-E-used]: B LegendO[Alta-disk-E-used]: Size Legend2[Alta-disk-E-used]: Temp disk E: used Title[Alta-disk-E-used]: Alta - 12GB EUMETCast disk partition PageTop[Alta-disk-E-used]: <H1>PC Alta - EUMETCast disk E: partition used (Edinburgh)</H1> #--------------------------------------------------------------- # PC Alta - Ramdisk Size #--------------------------------------------------------------- # The RAMdisk appears to be index 10 on PC Alta # Note that the following should all be on ONE line, not split at the "*" Target[alta-ramdisk]: 1.3.6.1.2.1.25.1.7.0&.1.3.6.1.2.1.25.2.3.1.6.10:public@127.0.0.1 * 1.3.6.1.2.1.25.1.7.0&.1.3.6.1.2.1.25.2.3.1.4.10:public@127.0.0.1 MaxBytes[alta-ramdisk]: 1050000000 Options[alta-ramdisk]: integer, gauge, nopercent, growright, unknaszero, noi WithPeak[alta-ramdisk]: wmy YLegend[alta-ramdisk]: RAMisk used (B) ShortLegend[alta-ramdisk]: B LegendO[alta-ramdisk]: Space used Legend2[alta-ramdisk]: RAMdisk used Legend4[alta-ramdisk]: Maximum 5-minute RAMdisk used Title[alta-ramdisk]: Alta - 1000 MB RAMdisk PageTop[alta-ramdisk]: <H1>PC Alta - 1000 MB RAMdisk Used (Edinburgh)</H1> #--------------------------------------------------------------- |
If you install and run the SpeedFan program from: http://www.almico.com/speedfan.php you can then install the SpeedFan SNMP Extension package from: http://deve.loping.net/projects/sfsnmp/ which provides SNMP access to the data provided by SpeedFan. The temperatures are in SNMP OIDs numbered:
.1.3.6.1.4.1.30503.1.2.1
.1.3.6.1.4.1.30503.1.2.2
.1.3.6.1.4.1.30503.1.2.3
and so forth. If you examine the output from the SpeedFan program temperatures display, and compare it to the values shown by GetIF, on the MBrowser tab, starting with OID:
.1.3.6.1.4.1.30503.1.2
you should be able to determine which OIDs on your system correspond to the CPU core temperatures on your own system. You can then create a suitable include file for MRTG such as the one shown below. However, on my system the values are returned in centi-degrees (i.e. 3000 = 30�C), and so need to be divided by 100 to get the actual temperature. You can achieve this using the arithmetic capability of MRTG adding a " / 100" after the usual string:
OID&OID:public@host / 100
Please note that there must be spaces around the
components of the arithmetic expression. Here's my include file:
|
Contents of narvik-cpu-temp.inc |
#--------------------------------------------------------------- # PC Narvik - CPU core temperatures #--------------------------------------------------------------- Target[narvik_cpu_temp]: .1.3.6.1.4.1.30503.1.2.3&.1.3.6.1.4.1.30503.1.2.4:public@localhost / 100 MaxBytes[narvik_cpu_temp]: 100 MaxBytes2[narvik_cpu_temp]: 100 Title[narvik_cpu_temp]: CPU core temperatures for PC Narvik Options[narvik_cpu_temp]: integer, gauge, nopercent, growright, unknaszero YLegend[narvik_cpu_temp]: Temperature �C ShortLegend[narvik_cpu_temp]: �C Legend1[narvik_cpu_temp]: CPU core 0 temperature in �C Legend2[narvik_cpu_temp]: CPU core 1 temperature in �C LegendI[narvik_cpu_temp]: CPU core 0 : LegendO[narvik_cpu_temp]: CPU core 1 : PageTop[narvik_cpu_temp]: <H1>PC Narvik -- CPU Core Temperatures</H1> |
 |
PC Stamsund CPU core temperatures |
Please note that the SpeedFan program must be running continuously for the SNMP DLL to see any data. This should not be too much of a visual distraction as the program minimises to a simple system tray icon. Note that the temperarature is a snapshot at the instant when MRTG reads the data - it isn't an averaged value over the last five minutes. Check what values SpeedFan provides holding the mouse over the SpeedFan icon - you may find one or more CPU temperatures and possibly even a GPU temperature.
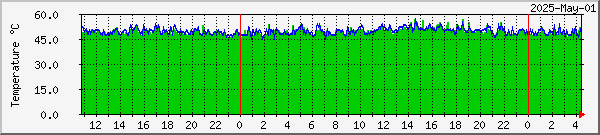
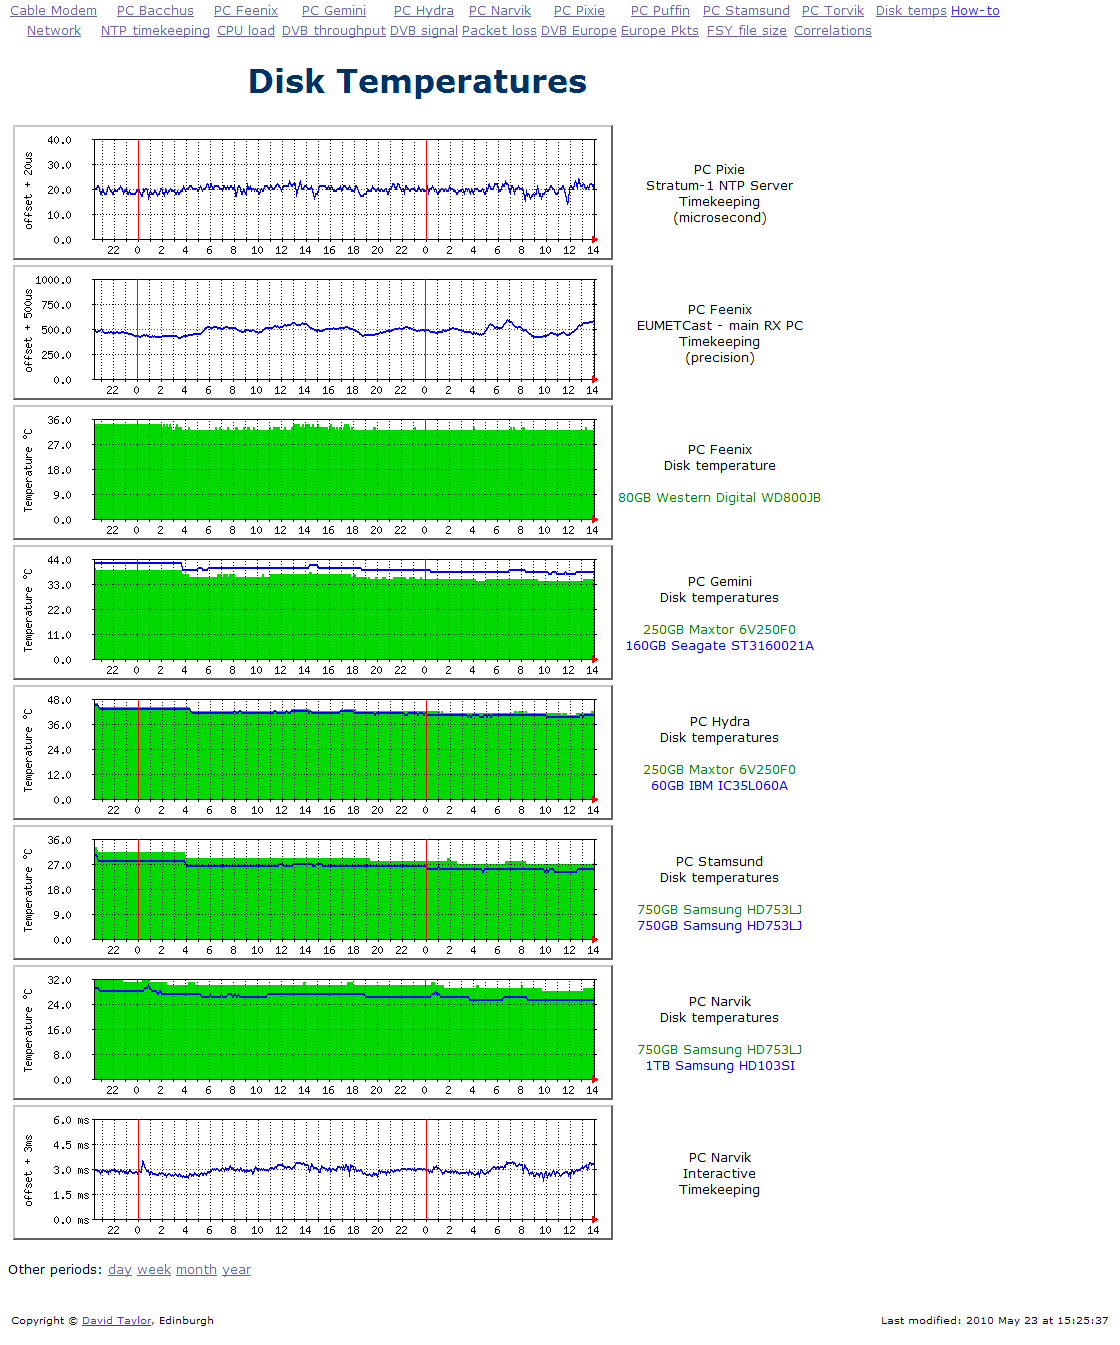
If you are fortunate enough to have a PC which is supported by the Mother Board Monitor program, you can just use that and add the appropriate SNMP objects as described above, or you may find that SpeedFan can also report disk temperature. My older PCs did not support MBM or SpeedFan for this, so I wrote a small program which accesses the S.M.A.R.T. data provided by some hard disks and the BIOS. Not all PCs do this, and not all PCs make all of the data accessible. To test your PC, download the DiskTemp.exe program, and run it from the command-line. Note that on Windows Vista and later, the program will have to be run in Administrator mode. You should see four lines like:
C:\>DiskTemp.exe 30 33 0 0 C:\> |
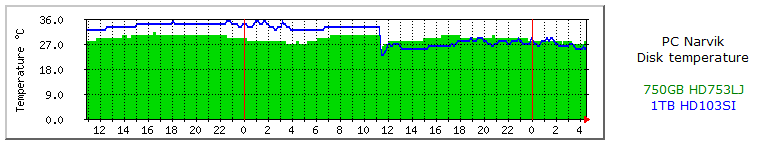
So as the program returns the disk temperatures (of the two disks on this PC), you can plot it in MRTG like this, using the ability of MRTG to read the output of a command-line program.
|
Contents of narvik-disk-temp.inc |
#--------------------------------------------------------------- # PC Narvik - disk temperatures #--------------------------------------------------------------- Target[narvik_disk_temp]: `DiskTemp` MaxBytes[narvik_disk_temp]: 100 MaxBytes2[narvik_disk_temp]: 100 Title[narvik_disk_temp]: Disk temperatures for PC Narvik Options[narvik_disk_temp]: integer, gauge, nopercent, growright, unknaszero YLegend[narvik_disk_temp]: Temperature �C ShortLegend[narvik_disk_temp]: �C Legend1[narvik_disk_temp]: Disk 0 temperature in �C Legend2[narvik_disk_temp]: Disk 1 temperature in �C LegendI[narvik_disk_temp]: Disk 0: LegendO[narvik_disk_temp]: Disk 1: PageTop[narvik_disk_temp]: <H1>PC Narvik -- Disk Temperatures</H1> |
 |
PC Kiruna Disk temperatures 3 TB WD Red - D: E: 3 TB WD Red - F: |
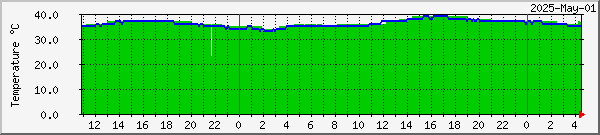
Here's another example, showing what happened when I replaced
a 750GB 7200rpm standard disk with a 1TB "eco" disk spinning at just
5400rpm, and with a slower seek speed. While the green line is more or
less constant allowing for the daily temperature changes, the blue line showing
the second disk on PC Narvik has dropped significantly from being a few degrees
above the 750GB disk to being a degree or three below. A lower working
temperature should produce greater reliability, and it's a few watts less power
consumption. Performance of the PC appears to be unaffected.
The horizontal lines from before 0800 to after 1100 were the nonexistent values
while the PC was powered down for the disk clone. After seeing those
misleading values, I added unknaszero to the options shown above.
I found that the code I used required to be run in Administrator mode with Windows Vista and Windows-7 and -8, which meant that I could not start MRTG automatically at startup. I decided that the best way to work round this problem was to write a separate program (DiskTemperatureReporter) to read the disk temperatures, and then deposit a file in the \MRTG\bin\ directory so that MRTG could read the data with the configuration:
Target[stamsund_disk_temp]: `type disk-temps.dat`
This enabled me to capture what was possibly the hottest May
day ever in Edinburgh - 2010 May 23 - and the next couple of days for
comparison! Here's
the screen-shot The DiskTemperatureReporter program is unpublished, but
available on an as-is basis by e-mail request. It needs to be started by
hand when the user logs into the PC.
Alternatively, you could use the SpeedFan & SNMP add-on mentioned above
which includes disk temperature monitoring.
http://www.pcsensor.com/index.php?_a=viewProd&productId=6
coupled with a simple program I wrote myself. The MRTG config lines are much like the disk temperature lines above. If you are interested in a copy of the Windows program, look here. If the product URL has changed, look for the product "USB TEMPer" on the site. Update Oct-2012: they now offer "gold TEMPer", but I don't know whether this is compatible with my software.
One thing I have been playing with since June 2011 is to record the
temperatures as 1000 times the actual value, i.e. milli-degrees.
This has two consequences - first that the data from the probes can be
recorded with greater precision. Although the probes are only accurate
to within a couple of degrees, they do record the data to greater precison -
perhaps half or a quarter degree C. Secondly, and perhaps more
importantly, using milli-degrees allows MRTG to record a more precise average
for the week, month and year graphs which are no longer limited to integer
temperature values. To allow this, the program has an option to multiply
returned values by 1000, enabled with the -1K parameter.
For outside tempertures, which could be negative Celsius, I have decided to
record Fahrenheit which are most unlikely to go negative here in Edinburgh.
This is enabled with the -F option to the program.
MRTG would normally display values such as 20,000 (i.e. from 20�C) as "20.0 k",
where the "k" is the standard thousands units multiplier. With capital
"K" also being temperature in Kelvins, this is doubly undesriable, so the
display of the units multipler is supressed with the "kMG" entry (see below).
To make the value displayed below the graphs correct, the "Factor" entry
is set to 0.001. Fortunately, although the documentation doesn't say so
explicitly, a floating point value is accepted here as the multipler.
Example graphs may be found here.
|
Ideas for the contents of: narvik-air-temperatures.inc |
#--------------------------------------------------------------- # PC Narvik - Example for indoor air temperature #--------------------------------------------------------------- Target[Narvik_air_temp]: `GetAirTemp -1K` MaxBytes[Narvik_air_temp]: 100000 MaxBytes2[Narvik_air_temp]: 100000 Title[Narvik_air_temp]: Air temperature for PC Narvik Options[Narvik_air_temp]: integer, gauge, nopercent, growright, unknaszero, noo YLegend[Narvik_air_temp]: Temperature �C ShortLegend[Narvik_air_temp]: �C kMG[Narvik_air_temp]: ,, Factor[Narvik_air_temp]: 0.001 Legend1[Narvik_air_temp]: Air temperature in �C LegendI[Narvik_air_temp]: Air temperature �C PageTop[Narvik_air_temp]: <H1>PC Narvik -- Air Temperature</H1> #--------------------------------------------------------------- # PC Narvik - Example for outside air temperature #--------------------------------------------------------------- Target[Narvik_air_temp_b]: `GetAirTemp -1K -F` MaxBytes[Narvik_air_temp_b]: 140000 MaxBytes2[Narvik_air_temp_b]: 140000 Title[Narvik_air_temp_b]: Outside air temperature Options[Narvik_air_temp_b]: integer, gauge, nopercent, growright, unknaszero, noo YLegend[Narvik_air_temp_b]: Temperature �F ShortLegend[Narvik_air_temp_b]: �F kMG[Narvik_air_temp_b]: ,, Factor[Narvik_air_temp_b]: 0.001 Legend1[Narvik_air_temp_b]: Outside air temperature in �F LegendI[Narvik_air_temp_b]: Outside Air temperature �F PageTop[Narvik_air_temp_b]: <H1>Outside Air Temperature</H1> |
Temperarture & humidity version of: narvik-air-temperatures.inc
The program has since been updated to handle the dual temperature and humidity
probe offered by the same vendor, taking the -T or -H parameter to specify
whether Temperature or Humidity should be returned. The MRTG lines for using
this facility are:
#---------------------------------------------------------------
# PC Narvik - Ambient air temperature
#---------------------------------------------------------------
Target[Narvik_air_temp]: `GetAirTemp -1K -T`
MaxBytes[Narvik_air_temp]: 100000
MaxBytes2[Narvik_air_temp]: 100000
Title[Narvik_air_temp]: Ambient air temperature for PC Narvik
Options[Narvik_air_temp]: integer, gauge, nopercent, growright, unknaszero, noo
YLegend[Narvik_air_temp]: Temperature �C
ShortLegend[Narvik_air_temp]: �C
kMG[Narvik_air_temp]: ,
Factor[Narvik_air_temp]: 0.001
Legend1[Narvik_air_temp]: Ambient air temperature in �C
LegendI[Narvik_air_temp]: Ambient Air temperature
PageTop[Narvik_air_temp]: <H1>Upstairs -- Ambient Air Temperature</H1>
#---------------------------------------------------------------
# PC Narvik - Humidity
#---------------------------------------------------------------
Target[Narvik_air_humidity]: `GetAirTemp -1K -H`
MaxBytes[Narvik_air_humidity]: 100000
MaxBytes2[Narvik_air_humidity]: 100000
Title[Narvik_air_humidity]: Relative humidity for PC Narvik
Options[Narvik_air_humidity]: integer, gauge, nopercent, growright, unknaszero, noi
YLegend[Narvik_air_humidity]: Humidity %
ShortLegend[Narvik_air_humidity]: %
kMG[Narvik_air_humidity]: ,
Factor[Narvik_air_humidity]: 0.001
Legend2[Narvik_air_humidity]: Relative humidity %
LegendO[Narvik_air_humidity]: Relative Humidity
PageTop[Narvik_air_humidity]: <H1>Upstairs Air -- Relative Humidity</H1>
I found that the Motorola Cable Modem I have happens to report its signal levels via SNMP, provided you know the right object ID (OID). I'm not sure where I found this data from, but you might want to search Google with "snmp oid docsIfDownChannelPower" or look here:
http://www.oidview.com/mibs/0/DOCS-IF-MIB.html
http://support.ipmonitor.com/mibs/DOCS-IF-MIB/item.aspx?id=docsIfDownChannelPower
The only thing of note is that I put the IP address for the cable modem into my Hosts file as "cm-hfc", since my ISP only provides a dynamic IP.
|
Contents of: cable-modem.inc |
#--------------------------------------------------------------- # Cable modem RF signal levels #--------------------------------------------------------------- Target[CM-levels]: 1.3.6.1.2.1.10.127.1.1.1.1.6.3&1.3.6.1.2.1.10.127.1.2.2.1.3.2:public@cm-hfc / 10 AbsMax[CM-levels]: 70 MaxBytes[CM-levels]: 70 Title[CM-levels]: Motorola SB5101E Cable Modem - RF Signal Levels Options[CM-levels]: integer, gauge, nopercent, growright, unknaszero ShortLegend[CM-levels]: dBmV YLegend[CM-levels]: dBmV LegendO[CM-levels]: Transmit level LegendI[CM-levels]: Received level Legend2[CM-levels]: Transmit (upstream) level: +30..+56dBmV is OK Legend1[CM-levels]: Received (downstream) level: -10..+10dBmV is OK PageTop[CM-levels]: <H2>Motorola SB5101E Cable Modem - RF Signal Levels</H2> #--------------------------------------------------------------- # Cable modem SNR #--------------------------------------------------------------- Target[CM-SNR]: 1.3.6.1.2.1.10.127.1.1.4.1.5.3&1.3.6.1.2.1.10.127.1.1.4.1.5.3:public@cm-hfc / 10 AbsMax[CM-SNR]: 70 MaxBytes[CM-SNR]: 70 Title[CM-SNR]: Motorola SB5101E Cable Modem - SNR & bandwidth Options[CM-SNR]: integer, gauge, nopercent, growright, unknaszero, noo ShortLegend[CM-SNR]: dB YLegend[CM-SNR]: dB LegendI[CM-SNR]: RX SNR Legend1[CM-SNR]: Received SNR (dB) PageTop[CM-SNR]: <H2>Motorola SB5101E Cable Modem - SNR</H2> #--------------------------------------------------------------- |
Recently I gained a Superhub 2, which makes the data you need more easily accessible, using URLs:
http://192.168.100.1/cgi-bin/VmRouterStatusDownstreamCfgCgi
http://192.168.100.1/cgi-bin/VmRouterStatusUpstreamCfgCgi
You can download the program here, and comments or suggestions for improvements are welcome. To provide greater accuracy for "recent" plots, and to avoid an "off-by-one" error in MRTG which can cause an apparent drop in values over time, values reported by the program are scaled up by 1000 and divided by 1000 before plotting. Thus a new MRTG configuration file is required.
|
Contents of: cable-modem.inc |
#--------------------------------------------------------------- # Cable modem RF signal levels #--------------------------------------------------------------- Target[CM-levels]: `CMget2 -LEVELS` AbsMax[CM-levels]: 70000 MaxBytes[CM-levels]: 70000 Factor[CM-levels]: 0.001 kMG[CM-levels]: , Title[CM-levels]: Virgin Media Superhub 2 - RF Signal Levels Options[CM-levels]: gauge, nopercent, growright, unknaszero ShortLegend[CM-levels]: dBmV YLegend[CM-levels]: Level dBmV LegendO[CM-levels]: Channel average transmit level LegendI[CM-levels]: Channel average receive level + 20dB Legend2[CM-levels]: Transmit (upstream 16QAM) level: +23..+55 dBmV acceptable Legend1[CM-levels]: Received (downstream 256QAM) level: -13..+17 dBmV acceptable PageTop[CM-levels]: <H1>Virgin Media Superhub 2 - DOCSIS 3.0 - RF Signal Levels</H1> <p>RX level has 20 dB added to allow RX levels below 0 dBmV to be plotted #--------------------------------------------------------------- # Cable modem SNR #--------------------------------------------------------------- Target[CM-SNR]: `CMget2 -SNR` AbsMax[CM-SNR]: 70000 MaxBytes[CM-SNR]: 70000 Factor[CM-SNR]: 0.001 kMG[CM-SNR]: , Title[CM-SNR]: Virgin Media Superhub 2 - SNR Options[CM-SNR]: gauge, nopercent, growright, unknaszero, noo ShortLegend[CM-SNR]: dB YLegend[CM-SNR]: SNR dB LegendI[CM-SNR]: RX SNR Legend1[CM-SNR]: Channel average receive MER 256QAM: >= 34.5 dB acceptable PageTop[CM-SNR]: <H2>Virgin Media Superhub 2 - DOCSIS 3.0 - SNR</H2> #--------------------------------------------------------------- |
Recently I needed to compare the performance of two ADS-B receivers.
Did the claimed higher message rate make any difference in practice?
Were aircraft received at a greater range? I wanted a graphical
comparison as I find that easiest to see the differences. Fortunately,
PlanePlotter allows access to its internal state via OLE/COM,
so I wrote a small piece of VBscript code to extract the data I needed, and
then configured an MRTG include file to plot that data. You can see
the script and include file below, warts, debugging code and all!
You can see the full set of results here, and an example from PC Penguin (my main uploading PC) is given below.
The code below assumes a maximum range of 500 km, and hence the maximum
message rate is limited to 500 messages per second to allow a common
plotting scale. Plot two separate graphs if this doesn't suit you, and
remove the "500" clip of maximum message rate in the VBscript.
I've left in the various debugging statements I used during testing.
This is my first "multi-line" VBscript, so likely it contains some examples
of bad practice, and even some errors. Have a good laugh if you are an
expert, but please also tell me how to improve the script. Script
updated 2017-Aug-17.
Contents of: GetMessageRate.vbs
Contents of: stamsund-PlanePlotter.inc
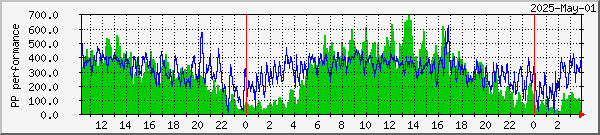
PC Penguin
Maximum range
Message rate
The VBscript starts with a great circle calculation routine. Opening the
PlanePlotter object, the script first gets the home location and message-rate.
It then reads all the aircraft which PlanePlotter currently knows about,
and gets a set of data for each. Only locally-received aircraft are
wanted so the script checks that the share code starts with an asterisk (*),
that the signal reported is greater than zero, and that the latitude and
longitude are not zero. Having looped over all the aircraft, the script
then writes the four lines required by MRTG to stdout.
Dim fso, f1, ts
Const ForWriting = 2
Const MrtgMax = 699
Set fso = CreateObject("Scripting.FileSystemObject")
Set stdout = fso.GetStandardStream (1)

Private Const C_RADIUS_EARTH_KM = 6370.97327862
Private Const C_PI = 3.14159265358979

Function GreatCircleDistance(Lat1_, Long1_, Lat2_, Long2_)

Dim Delta

' convert to radians: radians = (degrees/180) * PI
Lat1 = (Lat1_ / 180) * C_PI
Lat2 = (Lat2_ / 180) * C_PI
Long1 = (Long1_ / 180) * C_PI
Long2 = (Long2_ / 180) * C_PI

' get the central spherical angle
Delta = ((2 * ArcSin(Sqr((Sin((Lat1 - Lat2) / 2) ^ 2) + _
    Cos(Lat1) * Cos(Lat2) * (Sin((Long1 - Long2) / 2) ^ 2)))))

GreatCircleDistance = Delta * C_RADIUS_EARTH_KM

End Function

Function ArcSin(X)
    ' VBA doesn't have an ArcSin function. Improvise.
    ArcSin = Atn(X / Sqr(-X * X + 1))
End Function


Dim MyObject

Set PlanePlotterObject = GetObject(,"PlanePlotter.Document")

home_lat = PlanePlotterObject.GetHomeLat()
home_lon = PlanePlotterObject.GetHomeLon()
message_rate = PlanePlotterObject.GetDisplayParameter (5)

If message_rate > MrtgMax Then message_rate = MrtgMax

'WScript.Echo ("Home location, lat: " & home_lat & ", lon: " & home_lon)

' Get all aircraft

i = 0
local_count = 0
rx_count = 0
shared_count = 0
max_range = 0.0
max_flight = ""

While i < PlanePlotterObject.GetPlaneCount()

flight = PlanePlotterObject.GetPlaneData (i, 2)
lat = PlanePlotterObject.GetPlaneData (i, 3)
lon = PlanePlotterObject.GetPlaneData (i, 4)
share_code = Left (PlanePlotterObject.GetPlaneData (i, 13), 1)
signal = PlanePlotterObject.GetPlaneData (i, 26)

' check if it is local
if share_code = "*" then
  local_count = local_count + 1
  If signal > 0 Then rx_count = rx_count + 1
  ' Check for a valid lat and lon, and non-zero signal level
  If (lat <> 0) and (lon <> 0) and (signal >= 0) Then
    range = Int (GreatCircleDistance (home_lat, home_lon, lat, lon))
    If (range > max_range) and (range < MrtgMax) Then
      max_range = range
      max_flight = flight
    End If
  ' WScript.Echo (flight & " lat: " & lat & ", lon: " & lon & "  range: " & range)
  End If
else
  shared_count = shared_count + 1
end if

i = i + 1

Wend

'Wscript.Echo "Local: " & local_count & ",  shared: " & shared_count &_
'             ", max range: " & max_range & "  " & max_flight

stdout.WriteLine (message_rate)
stdout.WriteLine (max_range)
stdout.WriteLine (0)
stdout.WriteLine ("PlanePlotter")

'stdout.WriteLine ("Locals: " & local_count & ",  Signal > 0 " & rx_count)

' while 1
' message_rate = PlanePlotterObject.GetDisplayParameter (5)
' Wscript.Echo message_rate
' Wscript.Sleep(60000)
' Wend
#---------------------------------------------------------------
#	PC Stamsund - PlanePlotter
#---------------------------------------------------------------

Target[stamsund-pp-msgs-range]: `cscript /nologo GetMessageRate.vbs`
MaxBytes[stamsund-pp-msgs-range]: 50000
Options[stamsund-pp-msgs-range]: integer, gauge, nopercent, growright, unknaszero
WithPeak[stamsund-pp-msgs-range]: wmy
YLegend[stamsund-pp-msgs-range]: PP performance
ShortLegend[stamsund-pp-msgs-range]: .
LegendI[stamsund-pp-msgs-range]: Message rate (messages/s)
Legend1[stamsund-pp-msgs-range]: Message rate (messages/s)
Legend3[stamsund-pp-msgs-range]: Maximum 5-minute message rate
LegendO[stamsund-pp-msgs-range]: Maximum range (km)
Legend2[stamsund-pp-msgs-range]: Maximum range (km)
Legend4[stamsund-pp-msgs-range]: Maximum 5-minute range
Title[stamsund-pp-msgs-range]: Stamsund - PlanePlotter
PageTop[stamsund-pp-msgs-range]: <H1>PC Stamsund - PlanePlotter<;H1>

#---------------------------------------------------------------
Paul Marsh (@UHF_Satcom on Twitter) kindly sent a script to monitor the number of messages sent to FlightAware on the Raspberry Pi. Thanks!
|
Contents of: FlightAware.inc |
#---------------------------------------------------------------
#	FlightAware messages
#---------------------------------------------------------------

Target[piaware]: `/etc/piaware.sh`
MaxBytes[piaware]: 12500000
Options[piaware]: unknaszero,noinfo,nobanner,gauge, growright
PageTop[piaware]: <H1>FlightAware messages</H1>
Title[piaware]: FlightAware messages
ShortLegend[piaware]: Messages
#---------------------------------------------------------------
|
|
Contents of: /etc/piaware.sh |
piaware=`tail -n 20 /tmp/piaware.out|grep FlightAware|grep
airspy_adsb|tail -n1 |cut -f2 -d"("|cut -f1 -d" "`
up=`uptime |awk '{print $3" "$4}'|cut -f1 -d","`
echo $piaware
echo $piaware
echo $up
echo "piaware messages"
|
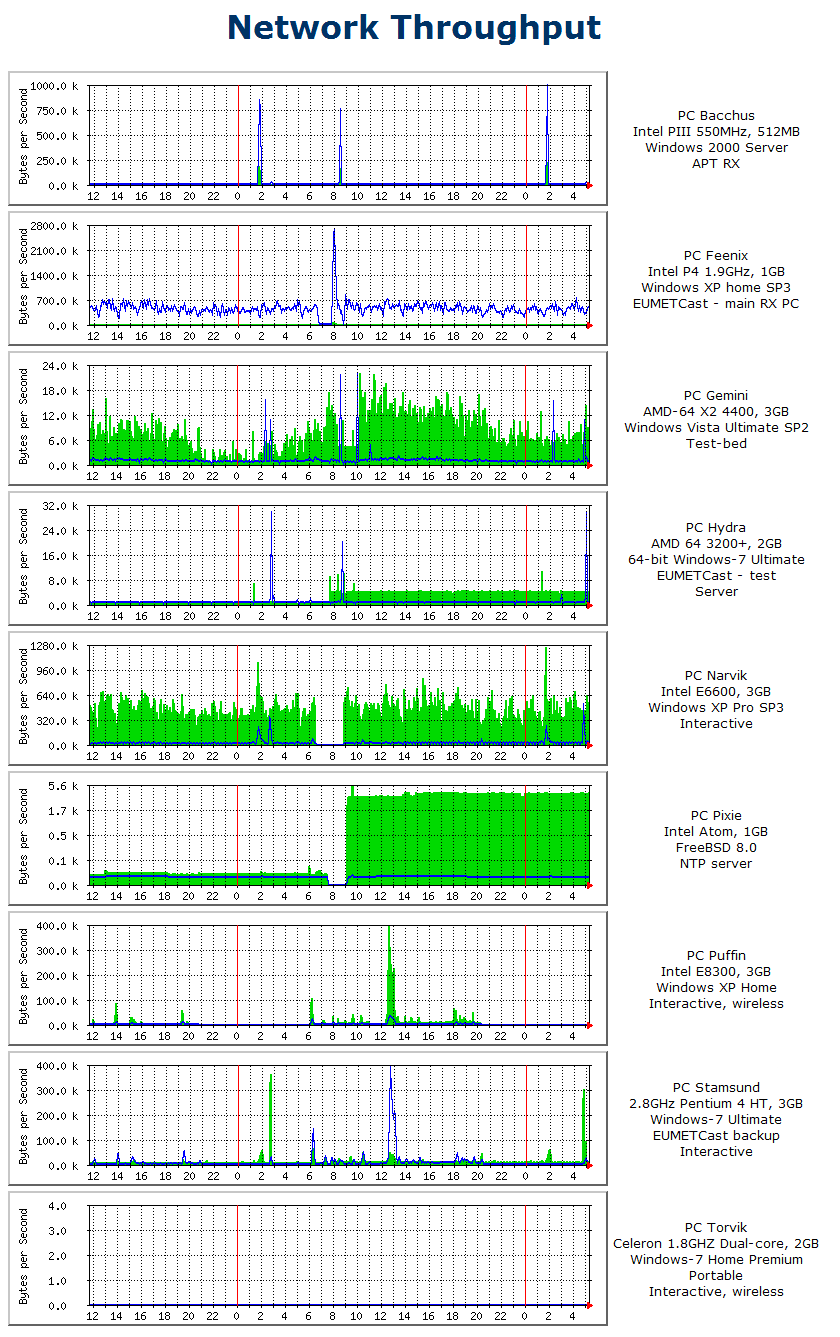
I haven't said anything about monitoring network I/O as this is already covered in the MRTG documentation.
I did happen to capture this
screenshot, showing just how useful having monitoring on your PCs can
be. In this case, I had changed the firewall on a PC, and suddenly the
network input to all devices on the network shot up. Checking with wireshark
on a laptop PC, the software was sending out 254 ARP packets every 120 seconds,
and each packet was the maximum wire size (1514 bytes). Other ARP packets
were either 42 or 60 bytes! I've reported this to the developers.
I
have found that interface numbers tend to change a lot on PCs, so these days
I tend to use the IP address format:
Target[pc-name]: /192.168.1.8:public@127.0.0.1
Acknowledgements: the SNMP work was triggered by an e-mail exchange with Lonni J Friedman who asked how I got MRTG working under Vista (answer: Run As Administrator, having added SNMP and allowed it through the firewall), but who had the performance monitoring working under Windows XP! Steve Catto first introduced me to MRTG - thanks Steve!
Update: I just found this PDF document which covers monitoring a Windows system with MRTG. Local copy as the original http://www.sans.edu/resources/student_presentations/mrtg_notes.pdf is no longer online.
| Copyright © David Taylor Edinburgh | SatSignal home page | Last modified: 2026 Mar 29 at 02:05:04 |