|
| |
Interpreting the "NTP Time function" program output
This program has two functions:
- Clock Sequence Test: to look for any
calls to GetSystemTimeAsFileTime where the
time goes backwards. This runs on the local PC, and so far no occurrences
have been found.
- Packet timestamps: to observe the timestamps in NTP packets
returned from a remote NTP server to determine:
- whether there are any packets where the server
timestamped the packet it sent before the packet it received
- what the offset of the TX and RX timestamps are
compared to a reference source, so that one can judge whether any jitter
seen on the difference of the packet timing is due to jitter on either
the TX or the RX timestamp.
Download the program.
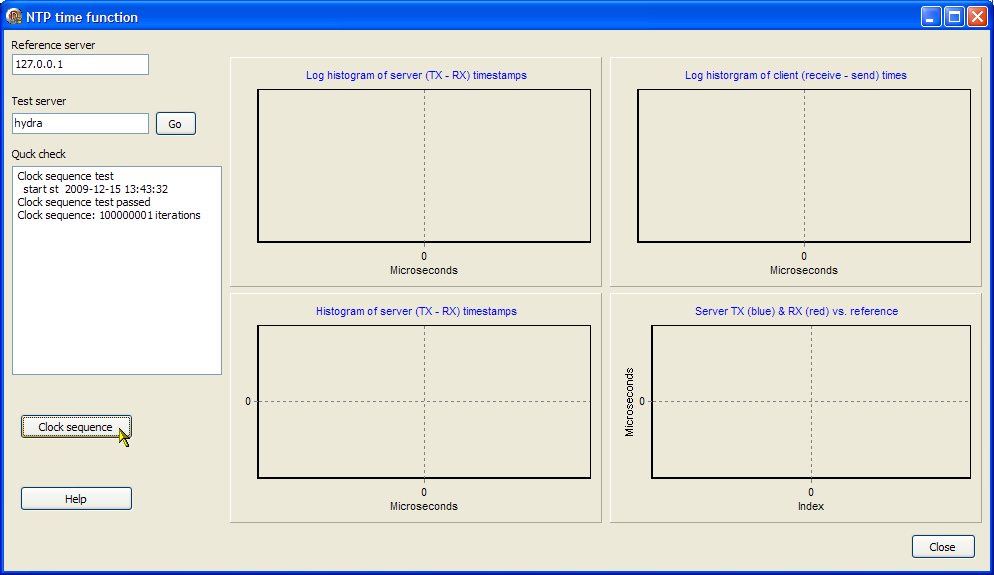
Clock Sequence Test
Pressing the Clock sequence button results in a large number
of calls to the GetSystemTimeAsFileTime
function, with the results being checked to make sure that time never goes
backwards. The results are in the charmingly mis-spelt Quick Check text as
shown below.
Packet timing - Windows-7 ref.clock server with Interpolation
The is the result of using the Go button to start a test
against an NTP server. In this case, I have selected an NTP server running
on Windows-7, with the interpolation enabled (which it is normally not on that
OS), and with a GPS/PPS reference clock. The text in the Quick check box
shows the timestamps in one packet received from the remote server (as specified
in the Test server box) and the time at which the program received the packet,
and is mainly for interest. The four graphs show:
- Top-left: a histogram of the difference between the server
TX and server RX timestamps. You would expect this value to be a small
positive number whose value depended on the time taken for the server to
respond, so a faster PC might produce a lesser time difference. In the
plot below, there are no values less than about 20 microseconds, the
majority of values are less than about 25 microseconds, but there are a few
values as long as 300 microseconds, where something may have interrupted the
NTP response and hence delayed timestamping the outgoing packet. A log
scale has been used to show these outliers.
- Bottom left: the same data as the upper graph, but
presented on a linear scale, showing the narrow range of response times for
the great majority of packets.
- Upper right: this is a histogram of the time the user
program took to complete the send-packet - wait - receive packet
sequence. This is also shown on a log scale. As expected, the
great majority of sequences took very little time, with one or two outliers
in the 15+ millisecond region, where the program was interrupted by other
activity on the analysis PC.
- Lower right: this shows the difference in time between the
"Reference server" and the Test server RX and TX timestamps. The
intention is that the the "Reference server" should be one with
low jitter, and the analysis PC itself was used in this case, with the time
derived from a simple NTP call. In this case, you can see the 2500
test packets plotted horizontally, with the (RX - reference) time plotted in
red, and the (TX - reference) time plotted in blue. It's possible to
conclude that:
- the server TX times (blue) are later than the server RX
times (red).
- there may be more jitter in the TX times than the RX
times.
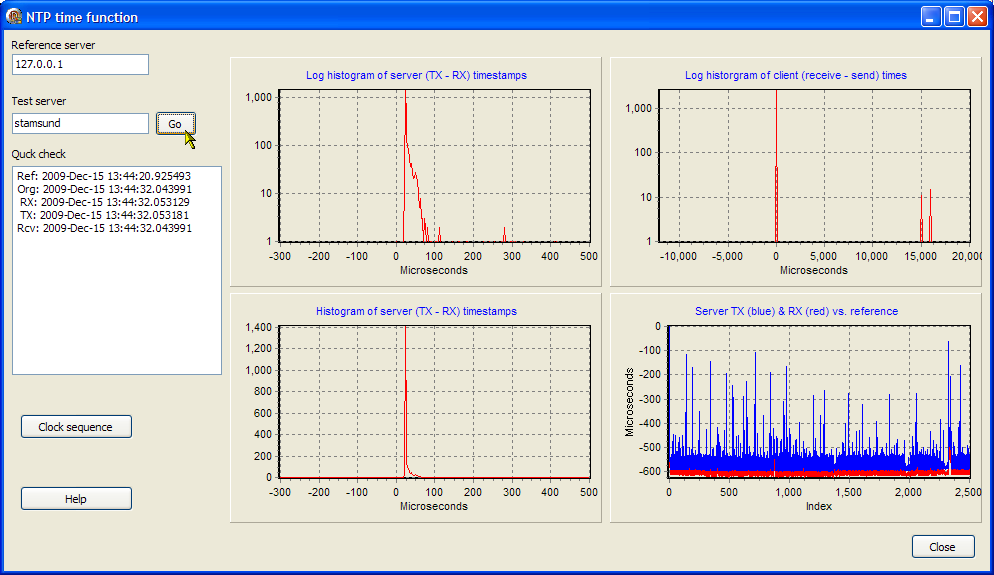
Packet timing - Windows-7 server without Interpolation
This is the result of running the test against a LAN-synced
Windows-7 PC, with the interpolation disabled as is normal and recommended for
Vista and Windows-7. Compared to the graphs above:
- The offset of TX to RX packets is no longer always
positive, but actually has a bipolar distribution.
- This means that about half the TX timestamps are before
the equivalent RX timestamp!
- The linear scaled plot shows the distribution to be
triangular (admittedly with some noise from only 2500 packets) with a total
width of about 2 milliseconds.
- A triangular distribution would result from the convolution
of two rectangular distributions of about 1miilisecond width each.
- From the lower-right graph, both the TX and RX packets
appear to have a 1 millisecond random distribution, so that the noise
contribution is not just from the TX or RX packet.
|