


|
|
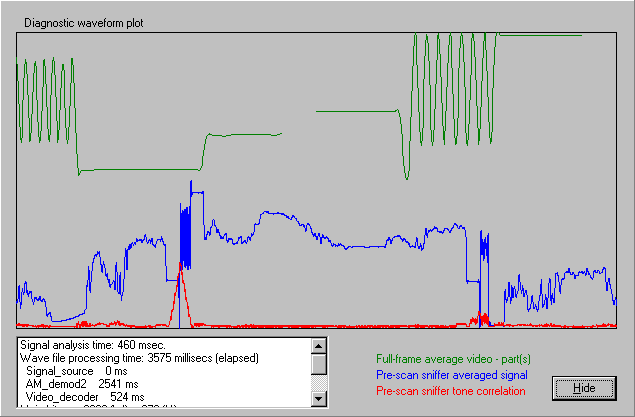
SatSignalThis is the program that has created the most interest. It would not have been necessary were it not for the fact that Christian Bock's otherwise excellent WXSat program lacks the ability to trigger to Meteor/Resurs signal, as it can a NOAA one, and the resulting image has slightly bent verticals, even when the parameters for WXSat are optimally adjusted. However, the program has been extended to cover a slightly different area than WXSat, in that the program can be completely automated, and will operate without intervention on most signals. To emphasis the difference between the two programs, SatSignal makes no attempt to operate in real-time, even though it is probably fast enough. I still use WXSat to record the wave files - I simply process them with SatSignal. The first phase of SatSignal's operation is to determine the type of satellite signal it is dealing with. It needs to do this to be able to operate automatically. The middle few seconds of the wave file are read and the 2400Hz tone is demodulated, and stored on a 1/2 second buffer circular. In this way, the signal, which repeats every 0.5 seconds is averaged, but noise and interference are not - they will tend to cancel rather than build up. The signal is split into two channels - one is direct and is used to measure the signal amplitude. In the other channel, the signal is multiplied (mixed) with the expected to frequency and the energy averaged over the expected tone duration. The output from this channel is near zero except where the tone is detected, and a triangular power waveform results, peaking with the tone. This waveform can be viewed on the View, Diagnostics screen. Click here to see a sample diagnostics screen shot. In fact, the satellites have different tone frequencies, and the energy in the tones depends on the satellite, with some satellites have a much greater tone duration as a fraction of the scan time, and having tones at frequencies that survive the averaging process rather better. For this reason, the program first tries to detect Meteor or Resurs (distinguishing these two by the position of the greyscale relative to the tone burst), then it looks for Okean (with 42 msec of 1200Hz tone), and finally NOAA with about 10msec of 832Hz tone. Having determined the satellite type, the program then proceeds to decode the entire wave file into an in-memory representation of the expected picture. It does this to 16-bit accuracy with 32-bit floating point processing so that all gain adjustments may be made after the wave file has been completely read, and as much information as possible about the signal is available. The 16-bit greyscale image, of uncertain amplitude, precludes as real-time display of the decoded data. As the wave file is demodulated, a video line averaged over all the image scan lines is built up for subsequent analysis. One problem that I had to tackle was how to find the sync pulses - sorry that's TV-speak for tone burst! What I ended up doing was to take the video signal and clip it about the mean level, and correlate against the expected sync pulse tone burst, looking for the maximum to declare "start-of-line". This is a computationally expensive process, so once a valid sync pulse is found, the remaining video for the rest of the line is passed directly, with the correlation process only being restarted just before the sync pulse is expected. Thus the technique combines elements of both phase-locked loops and triggering. The post processing takes different routes depending on the satellite. Meteor/ResursThe average video line, computed during the entire pass, is examined to determine the exact location of the greyscale and the black region of the image. It is assumed that the value of black will be constant during the pass, so the black region of each line is averaged to compute the signal level corresponding to black. To ensure that bursts of interference do not upset the correct value, only lines where the noise on the black level is low are averaged. (This would fail if the interference totally blanked the signal). The required gain is such as to make the grey scale just fit in the range 0..16383 (i.e an eight bit range shifted left by 6 bits), so the mean level of the greyscale is measured for each line, and used to compute required gain for the signal. This gain is averaged over the pass so that interference does not produce undesired band in the picture. While the signal is still in the 16-bit domain, the histogram may be equalised, which ensures that maximum use is made of small level differences between land and sea. In addition, any required gamma correction is made to match the continuous range of grey levels to the non-linear charatceristic of the typical PC display. Gamma correction has the effect of boosting the brightness of the dark land and sea areas. The user can also request that the image be interpolated to produce double the number of pixels. Interpolation is possible as the full 0.5 seconds is available to the horizontal scan - recall that on NOAA two pictures are sent side by side in the same period of time. My personal feeling is that Meteor 3-5 deserves this interpolation, but that no other satellites truly offer any more information when the image is interpolated, however the presented image certainly looks better. Finally, the image is rotated by 180ş if the pass is northbound rather than southbound, can be sharpened if desired, and is shifted right by 6 bits to normalise it into the 0..255 range of an eight-bit image. Only at this point is it ready for display. OkeanLimited Okean support has only recently been added, and it basically follows the path above, except that as there is no continuous greyscale, just the black and white "piano-key" pattern, all I do is to scan the signal for low-noise black and white segments, so that I can compute the gain and offset required. The signal is assumed to have the same gain and offset across the entire pass. NOAA APTThe basic processing of the NOAA APT signal is as described above for Meteor/Resurs, except that the greyscale wedges are scanned down the picture to determine the minimum and maximum levels. It is assumed that the gain is constant across the pass, as correction will be made either in the APTprocessor program, or in subsequent two-channel processing. The aim here is to produce as precise a copy of possible of the wave file into a bitmap. Interpolation is not allowed for NOAA main side-by-side image, as it would confuse subsequent processing, and the images do not have the information content to justify interpolation. Rather complex additional processing is then performed, in parallel with the production of a pristine side-by-side image. The complexity can be judged by the fact that the code makes up almost half of the video-decoding unit.
Next: Using SatSignal |
|
|