| Harstad | Kiruna | Lund | Oslo | Penguin | RPi 1 3 4 5 8 9 10 11 12 13 14 15 16 17 18 19 20 21 22 23 24 25 28 29 30 | Pixie | Condor | Drammen | Floro | Ystad | Web srv | |||
| WAN | Network | Timekeeping | CPU/mem | EUMETCast Europe | DVB-S2 | Ecast I/O | Losses | HVS losses | RAMdisk | T1/T2 | Air °C | ADS-B | GPS | DOP | SNR | NTP jitter | How-to | |
EUMETCast SNR & Quality
 |
Main PC - Feenix, Win-XP SkyStar V2.6B? PCI card V4.6.0 drivers SNR (dB x 10) Quality % |
|
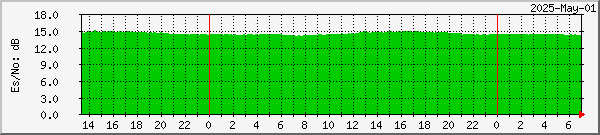 |
Ayeacka SR 1 DVB-S2 IP receiver SNR (dB x 10) |
|
 |
Ayeacka SR 1 DVB-S2 IP receiver Link margin (dB x 10) |
|
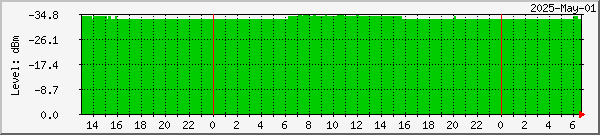 |
Ayeacka SR 1 DVB-S2 IP receiver Level below 0 dBm (x 10) On splitter after 2014-Feb-09 Higher plot means less signal! |
Other periods: day week month year
Data is subject to change. This data is taken from PCs fed by Ayecka SR1 IP and TBS receivers. The RF feeds are shown in red. The antenna is pointed to the Hotbird 13G satellite at 13° E since mid-July 2024. Readings are taken every five minutes, and X-axis times are in UTC. The four outputs are used to feed the three main receivers. Output one from the LNB is used for BAS and HVS-1, three is used for HVS-2, and output four allows direct access to the LNB for polarisation tests, which would otherwise interfere with routine reception. Output 2 is available for HVS-3 tests, and output for general tests.
Multiple receive PCs are fed from the Traffic LAN ports of the Ayecka SR 1 IP BAS/HVS-1receiver on a private LAN (192.168.10.x) via GS605 Netgear switches, with 1 Gbps network cards added to the receiver PCs. An Edimax USB2.0-Ethernet adapter is an alternative because of the need to use USB or better drivers. Ayecka SR1 #1 receiver takes both BAS and HVS-1. HVS-1 is received and processed by PC Kiruna, and received by PC Lund, processed by PC Penguin...
The Ayecka SR1 Management ports are connected to the
existing 192.168.0.x house LAN, through
which management access is possible from any local PC.
|
125
cm antenna with quad-output
LNB pointed at EUTELSAT HOTBIRD 13G |
||||||||||||||||
|
Output 1 |
Output 2 | Output 3 | Output 4 | |||||||||||||
|
|| |
|| | || | || | |||||||||||||
|
|| |
|| | 2-way splitter | || | |||||||||||||
| || | || | RF only | DC-pass | || | ||||||||||||
| || | || | || | || | || | ||||||||||||
| Ayecka SR1 #1 BAS & HVS-1 |
Ayecka SR1 #2 HVS-3 |
TBS6903 dual-tuner PCIe |
Ayecka SR1 #3 HVS-2 only |
TBS5925 box USB pass-through |
||||||||||||
| | | | | | | | | | | || | |||||||||||
| 1 Gbps Ethernet |
1 Gbps Ethernet |
PCIe card |
1
Gbps Ethernet |
USB 2.0 | |
|| || |
|||||||||||
| | | | | | | | | Airspy SDR Mini hardware |
||||||||||||
|
<=========== |
== |
=== |
Private |
LAN |
== |
= |
========= |
== |
==== | |
=> | |
| | |||||
| | | | | | | | | | | |
| | |
| | | | |||||||||
(spare)
|
i5-4460 PC Harstad Receive BAS |
i5-8400
PC Penguin BAS recv & process HVS-1 process |
i7-4770K PC Kiruna BAS process HVS-1 receive HVS-1 process |
i5-6400 PC Lund Recv HVS-1 Recv HVS-2 |
i7-10700-
PC Oslo Recv HVS-1 Recv HVS-2 |
Tablet test PC Vega BDADataEx CrazyScan SDR# Spectrum Spy Smart DVB & TS analyser |
||||||||||