


|
|
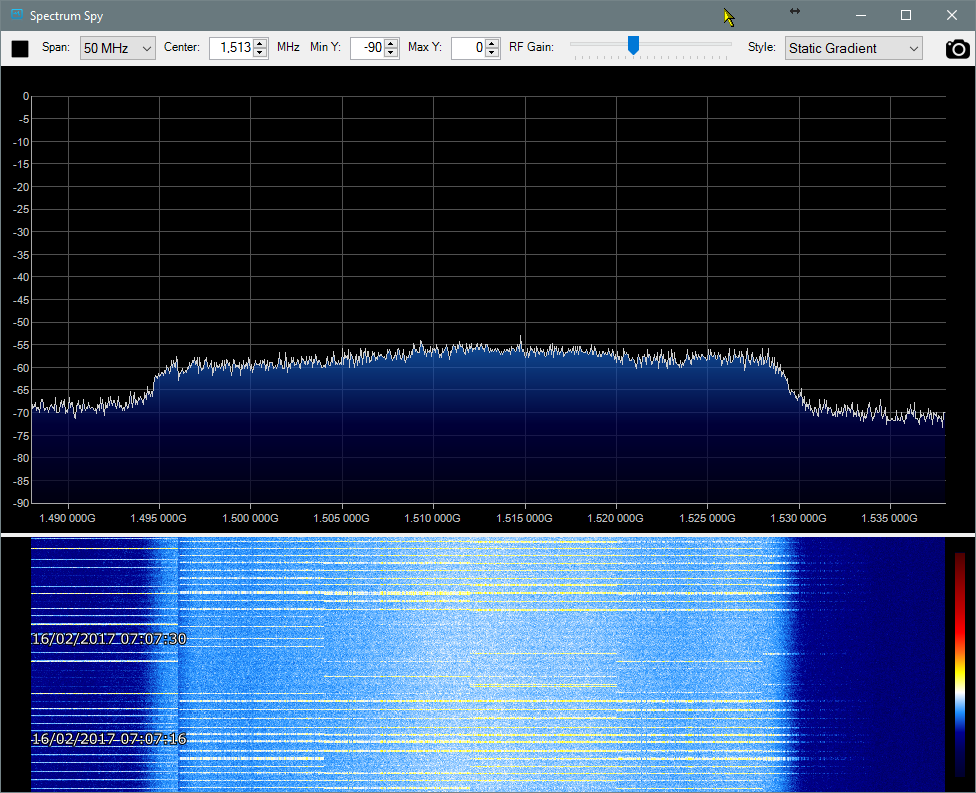
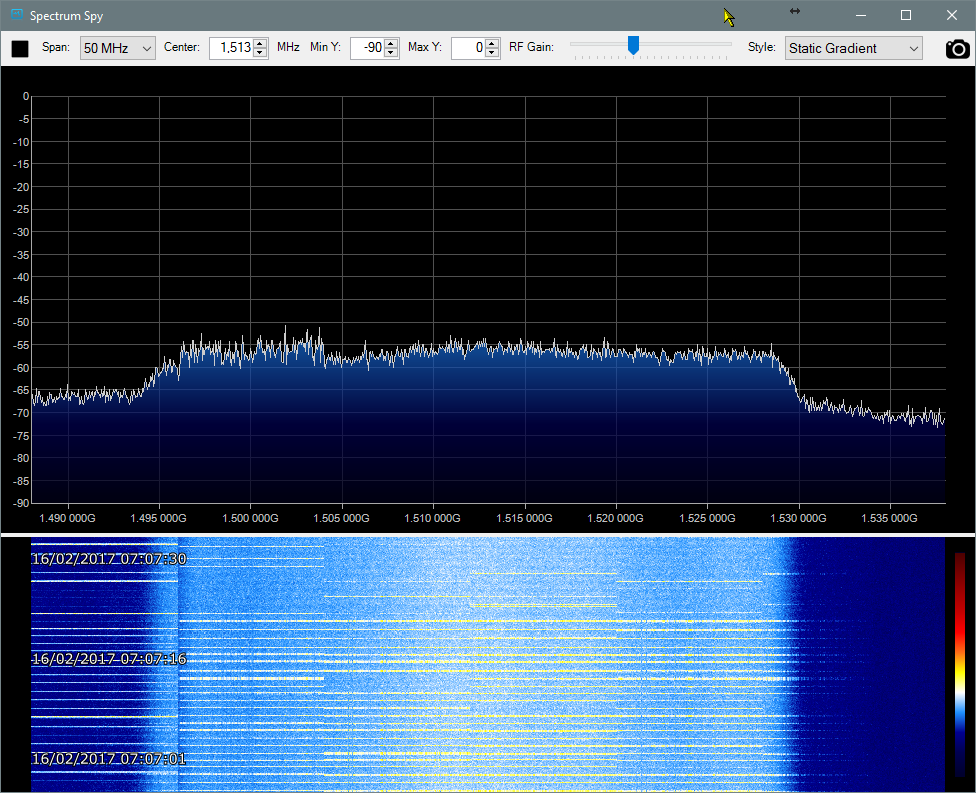
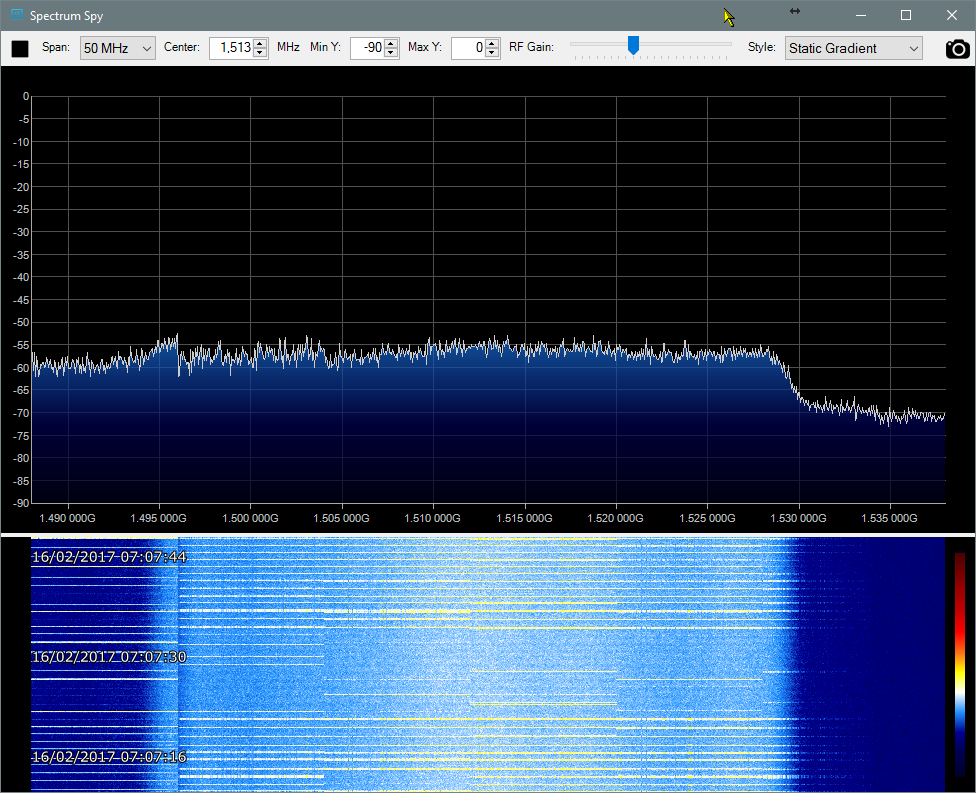
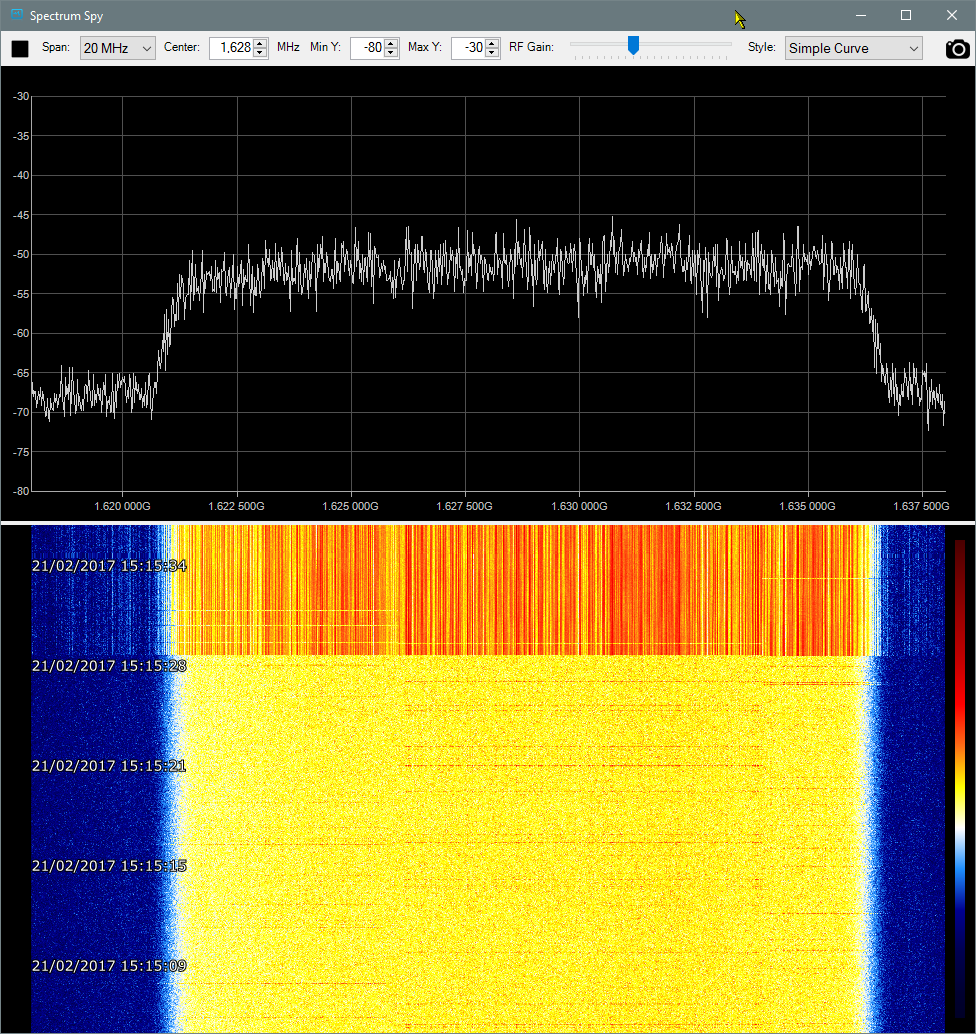
Transponders 1 & 2Some comparisons of the two transponders due to be in use by EUMETCast. Both transponders are on the EUTELSAT 10A satellite, and as of February 2017 transponder 1 is in operational use for the Basic Service (BS) and High Volume Service (HVS-1), transponder 2 is undergoing tests prior to its transition to the second High Volume Service (HVS-2) later in the year. Using Airspy SDR receiver and SpectrumSpy softwareTransponder 1Airspy SDR receiver & software. Transponder 1 shows two interesting effects.
A - Normal operation with the variation of signal level apparent as the different colours of the waterfall plot beneath the spectrum.
B - shows the level variation during a sweep of the spectrum analyser software. Note that the level in the first part of the scan appears higher than that during most of the scan.
C - showing the apparent energy below the nominal bandwidth. Analyser artefact, effect of mode switching or another transponder spreading?
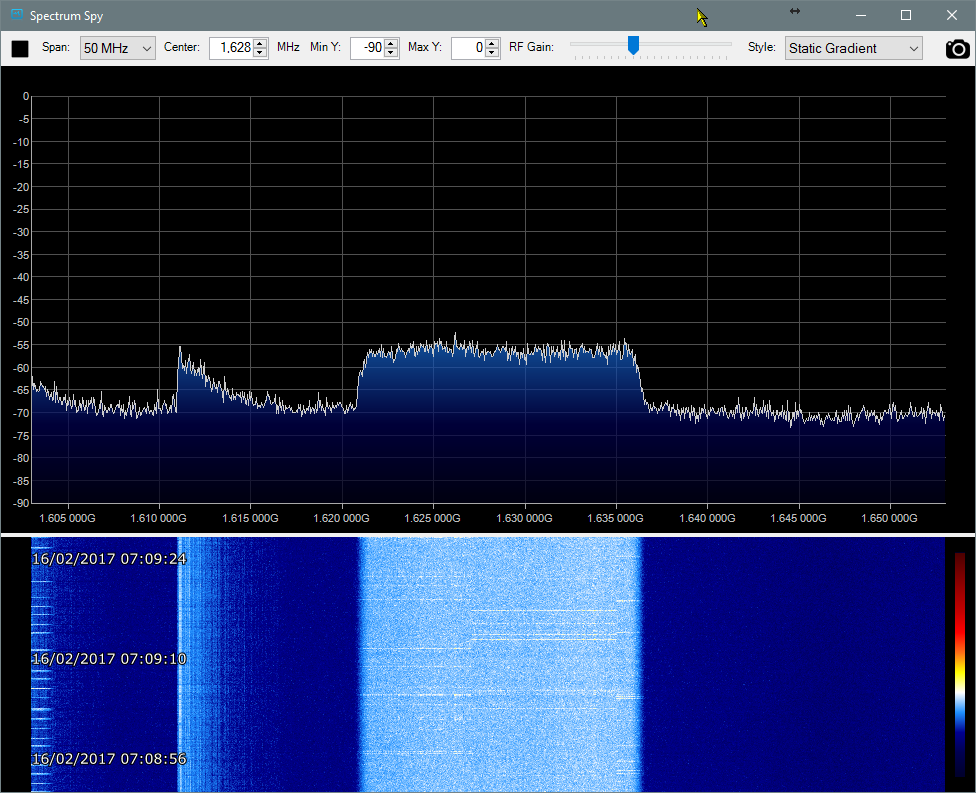
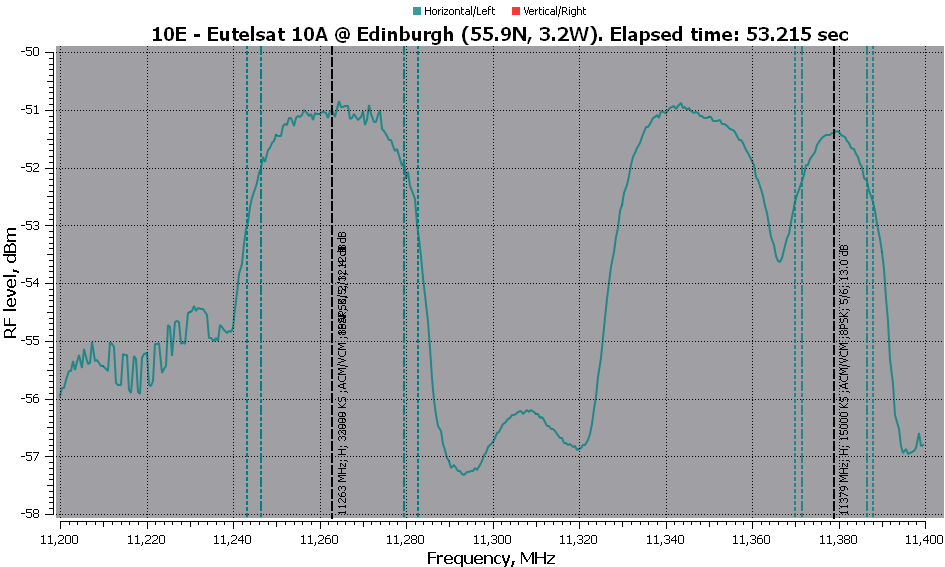
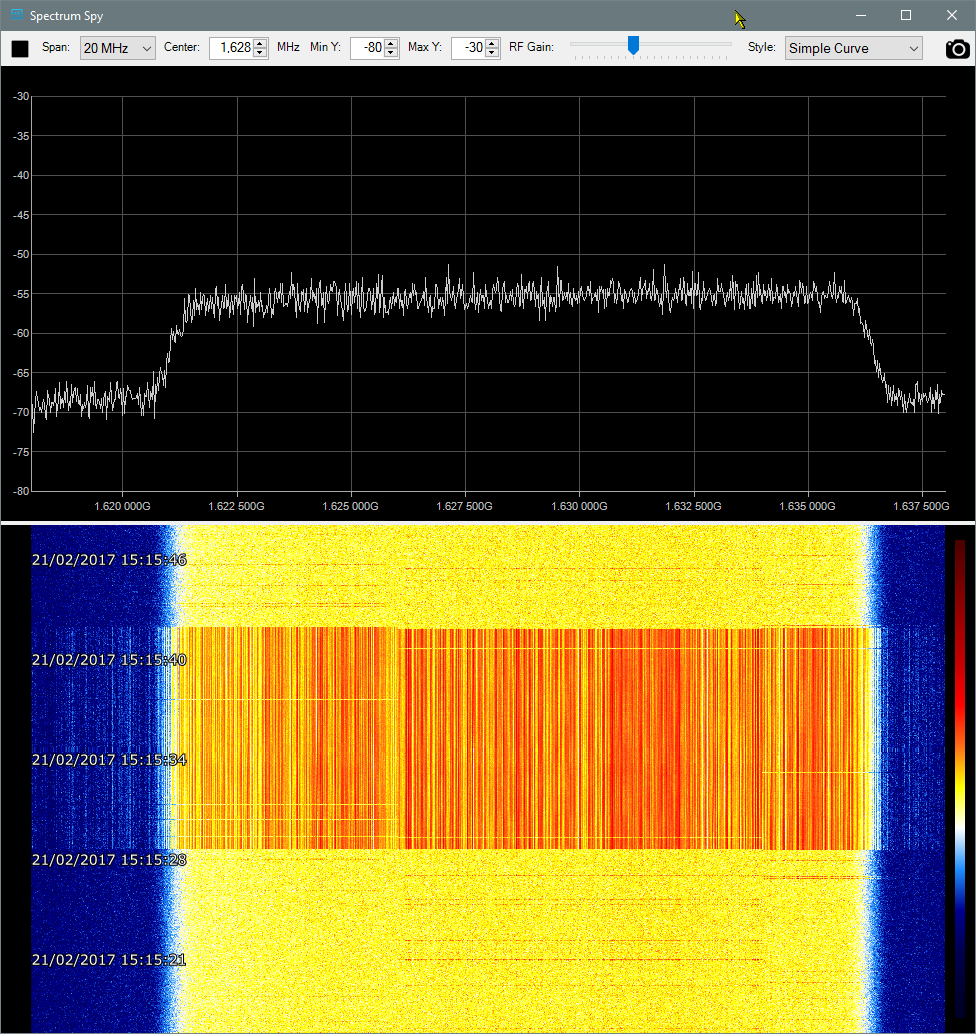
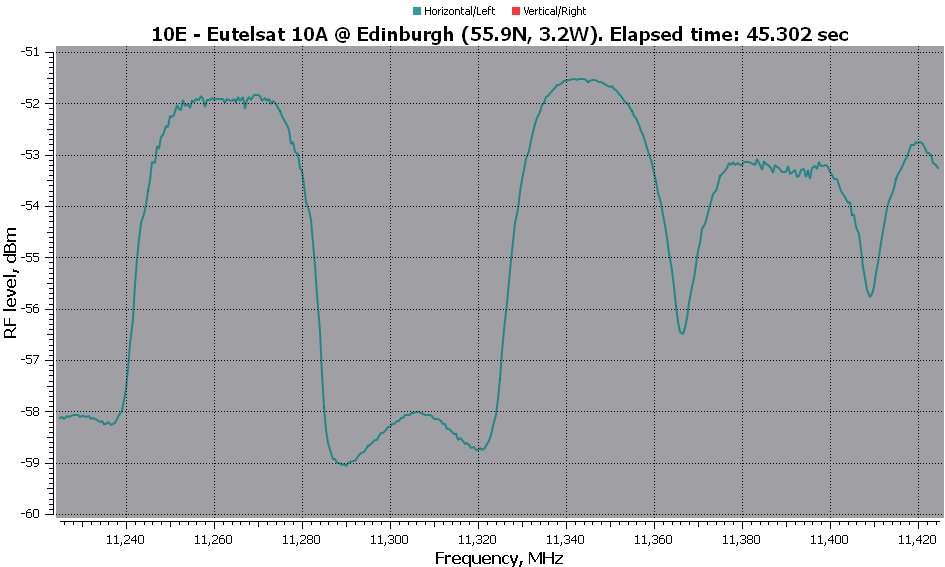
Transponder 2Transponder 2 shows a well-defined ~15 MHz bandwidth, but with the tail of the next LF transponder around 11362 MHz (you need to add 9750 to the frequencies on the graph). Es/No is around 12-13 dB.
Using CrazyScan toolFirst, a plot of the RF level covering the two transponders, using the CrazyScan software and the TBS 1.0.0.5 driver under Windows-10/32. We see that the RF level of transponder 2 is rather down on transponder 1, and that if appears to have a nearby signal which would prevent it's use at full bandwidth at the moment. Obviously this will be resolved before the transponder comes into full service. Note that the polarity switching was not available on this RF feed, so only the horizontally polarised signals are measured. Also note that I don't believe the RF level values (and will take this up with CrazyCat). The SNR on transponder 2 shows as 13.0 dB, but looks more like 5.5 dB.
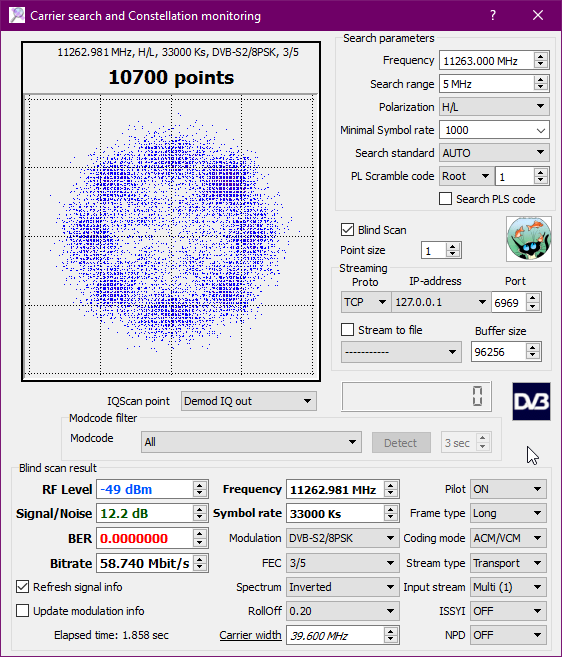
Transponder 1 constellationMore interesting are the constellation plots. That from transponder 1 quite clearly shows the 8PSK MODCOD as clusters around 12 o'clock, 1:30, 3 o'clock and so forth. This has the 16APSK data superimposed visible as less well-defined clusters towards the centre of the plot. The rate is 33,000 kSps.
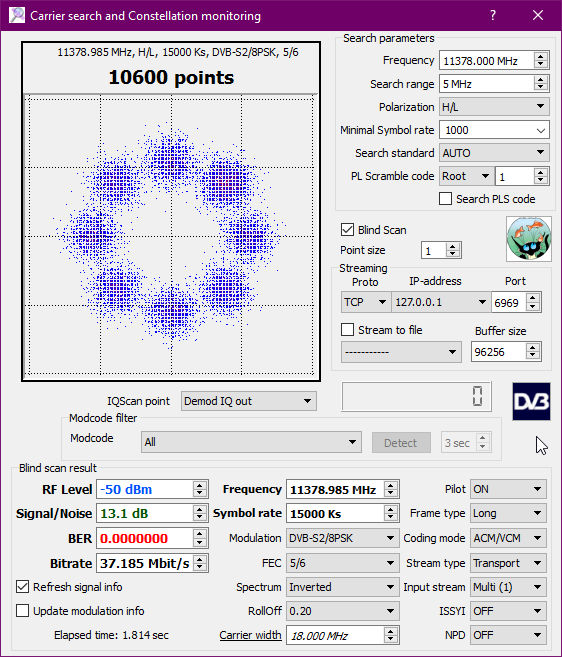
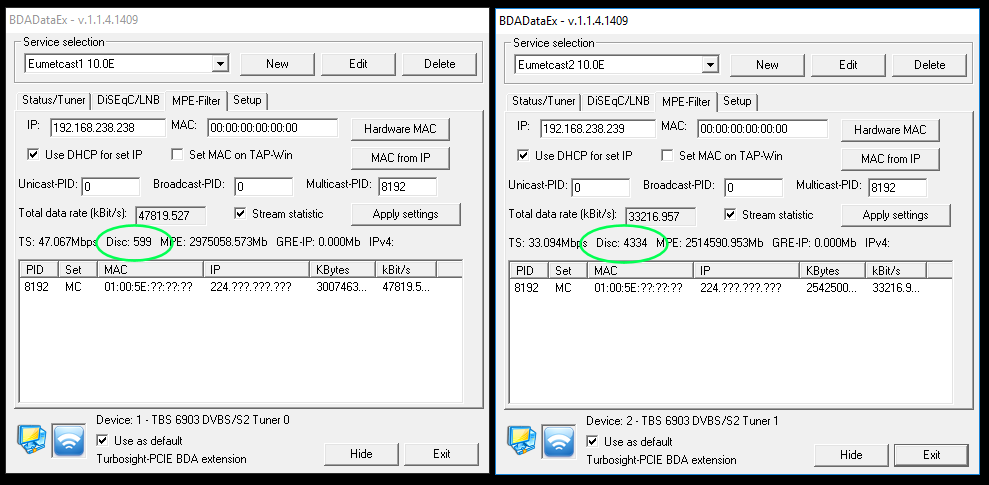
Transponder 2 constellationAt the time of testing, transponder 2 was running 8PSK 5/6 at a 15,000 kSps rate. The clusters are well-defined. Errors on T2Like others, with the present configuration I do see more errors on transponder 2 versus transponder 1. At the moment my transponder 1 isn't error-free likely due to local effects (e.g. wind bursts), but here's my comparison:
CrazyCat also published a comparison, although that seems to have been removed.
Transponder 2 - file transfer and gapHere's what I see during a file transfer on the test transponder 2 configuration. Whether it's an artefact of the interaction between the transponder's resting state (and what "fill" DVB-S2 pattern), or whether it's genuine I don't know, but here are the three plots, showing during a file transfer, during a gap, and after the gap showing the duration of the resting state. During the transfer
During the gap
After the gap
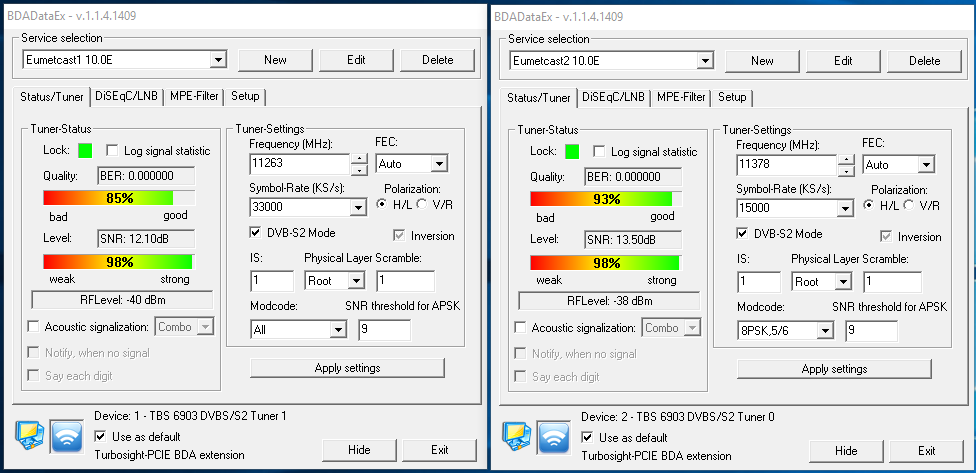
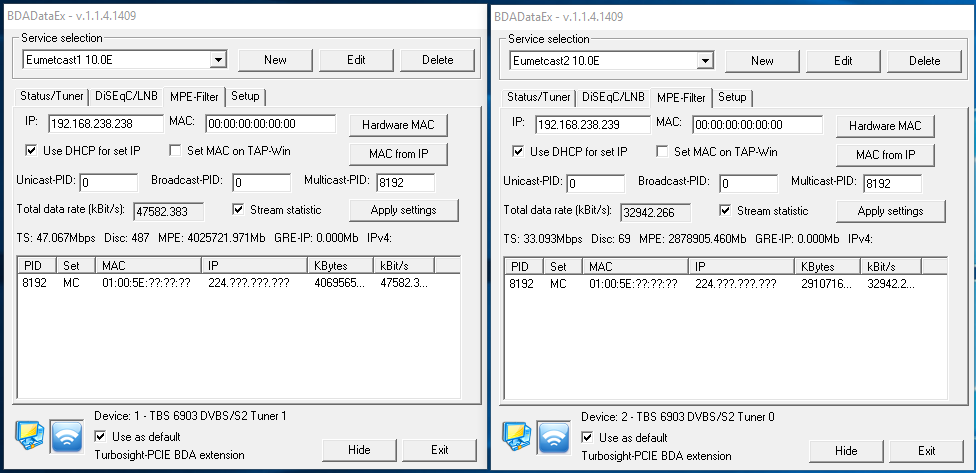
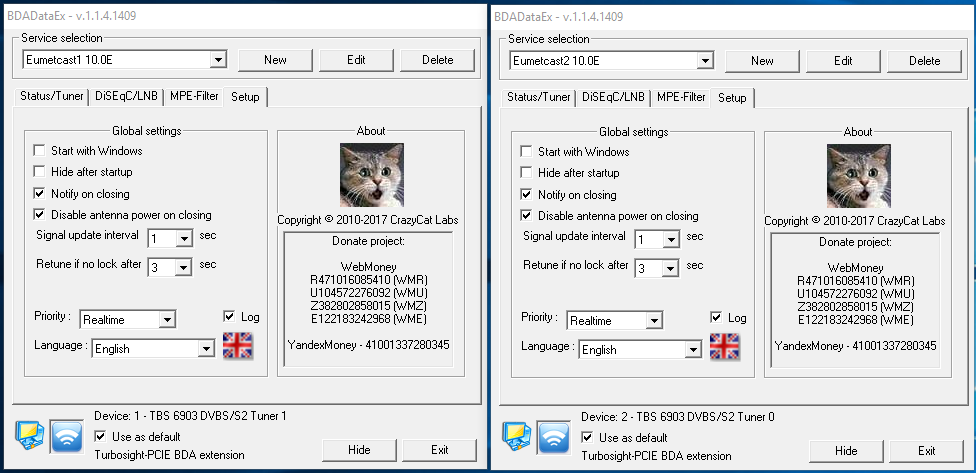
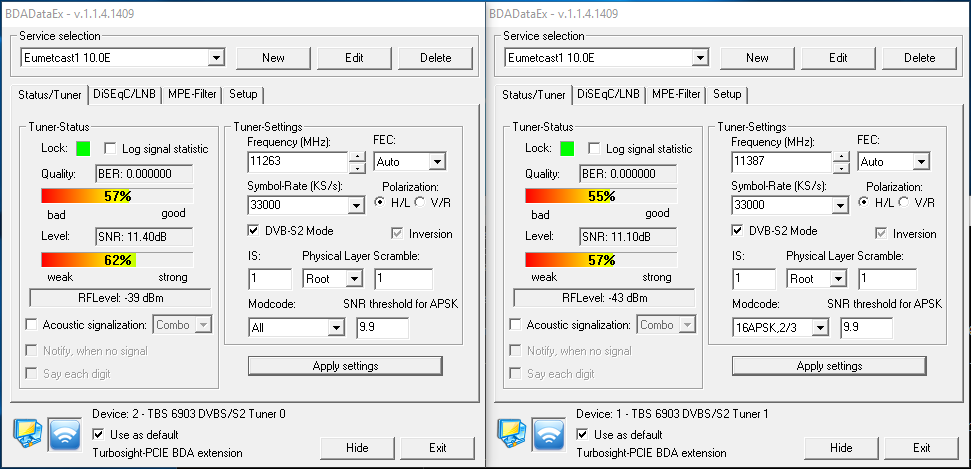
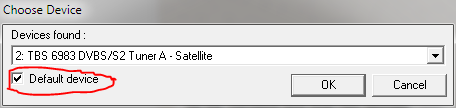
SetupI have been asked about the dual-tuner, single cable setup. This was made possible by software (after a considerable effort and investigation) by CrazyCat. Here are my screen-shots - I hope they help. Note that transponder-2 changed parameters during July 2017 so for the correct T2 settings, please see here. Some folk have set the "Log signal statistic" box, and wondered why their disk had filled! A green (rather than blue) icon may be a clue to this... Status/Tuner tab - BS & HVS-1 is on the left, HVS-2 (test period) on the right.
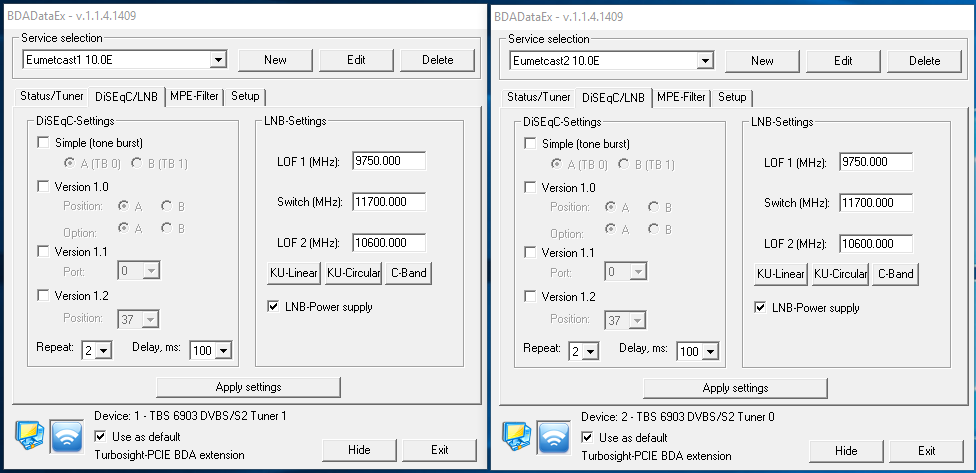
DiSEqC/LNB tab
MPE-Filter tab
Setup tab
Full transponder 2 - July 2017Please note the changed settings from the test period to the full transponder. The frequency, symbol rate and MODCOD are different, and setting the SNR threshold to 9.9 dB is then similar to that recommended by EUMETSAT for other receivers. Again, some folk have set the "Log signal statistic" box, and wondered why their disk had filled! A green (rather than blue) icon may be a clue to this...
In July 2017 the full bandwidth of the second transponder became available for EUMETSAT's second HVS serveice (HVS-2) on EUMETCast Europe. However, initial operations shows that the SNR was less than that of transponder 1, which was itself a little down from its value until the middle of week 25 (June 21). These issues are under investigation by EUMETSAT and the service provider. Just as a reference point, I repeated some of the measurements above using a cable splitter off my Ayecka SR1 #3 feed (itself already split between the Ayecka #3 and a TBS6903 PCIe card), to feed the LNB input of a TBS5925 box, and took the output from the "Loop out" port to the Airpsy SDR receiver. For more information, please see the notes above on the tests done previously. Discussion: The first plot is from CrazyCat's CrazyScan software which plots the reported received signal level versus frequency. The slight noise increase around 11310 MHz was present in the earlier plots. Transponder 1 is at 11262.5 MHz and transponder 2 at 11387.5 MHz. T2 plots are some 1.3 dB down on T1. To make these measurements I believe that the receiver will have to be set by the software to its narrowest bandwidth, but this will not be as narrow as the Spectrum Spy plots below. However the averaging produces a much smoother plot, and allows more precise measurements.
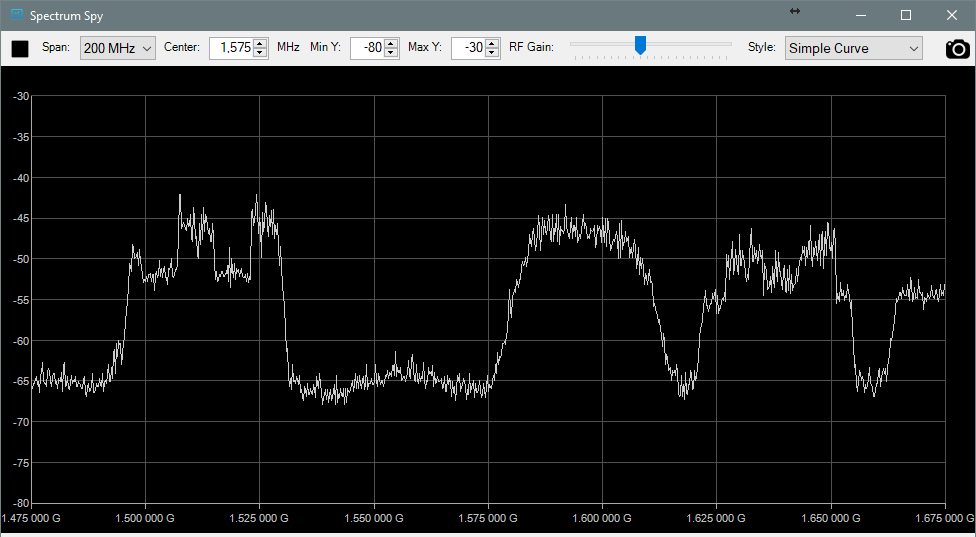
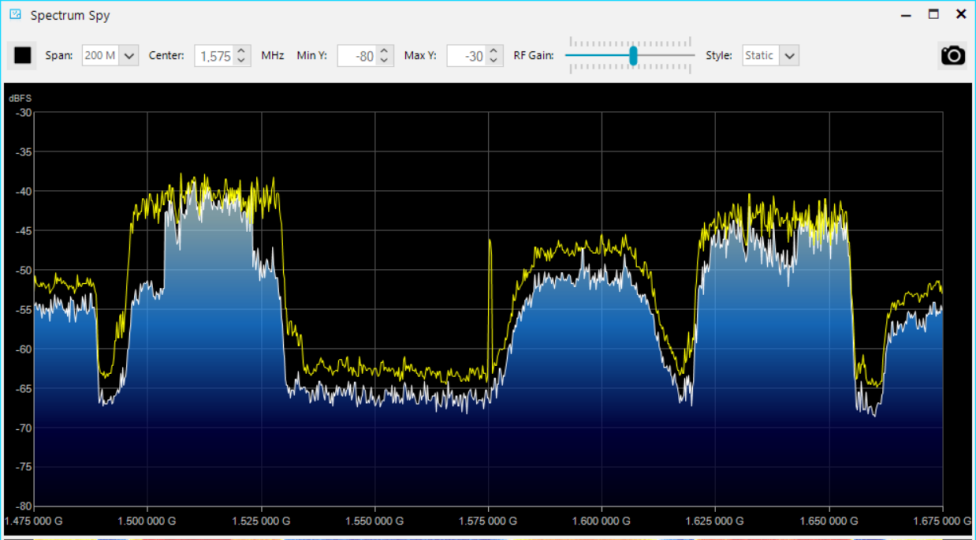
The plot below is more like that seen on a traditional spectrum analyser, and the (software) receiver used has a much narrower bandwidth than the TBS5925, which shows the 20% roll-off on T2 compared to the 5% roll-off of T1 as a more gentle slope to the edges of its spectrum. T1 is again on the left, occupying frequencies spanning 1500 to 1525 MHz, and T2 spans frequencies spanning 1625 and 1650 MHz. Both signals are changing rapidly which is averaged out in the CrazyScan plot, but which appear as switched levels in the Spectrum Spy plot. However, it's clear that while the noise floor remains approximately constant around -65 dB, the peaks of the transponder 2 signal are less than those of the transponder 1 signal. In 2020 the SpectrumSpy software was upgraded to include a peak hold facility - shown here in yellow - which handles the dual mode DVB-S2 signal better. Please note that this is simply a snapshot of how things were oat around 13:00 UTC on 2017-Jul-05, and that things will change during the subsequent days. I would be most interested to hear from anyone making similar measurements.
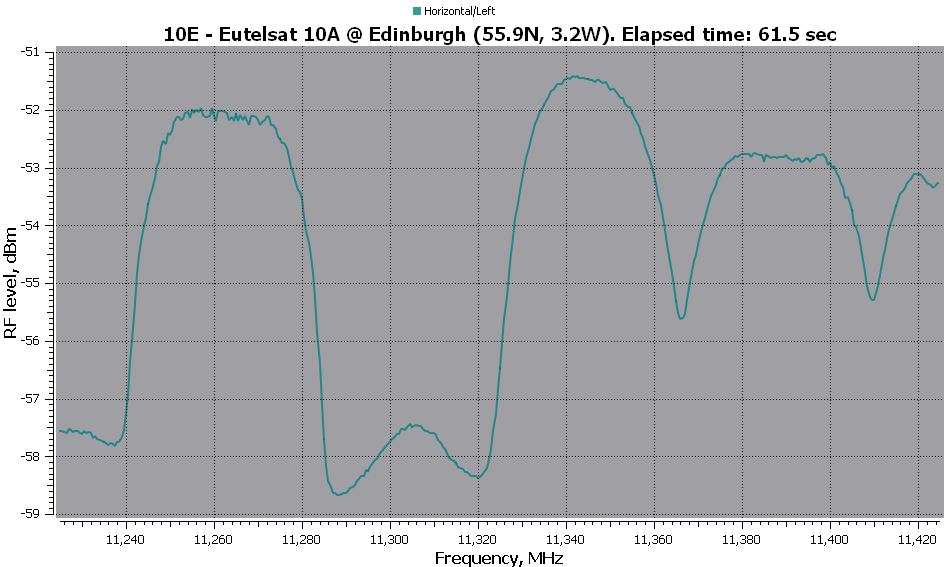
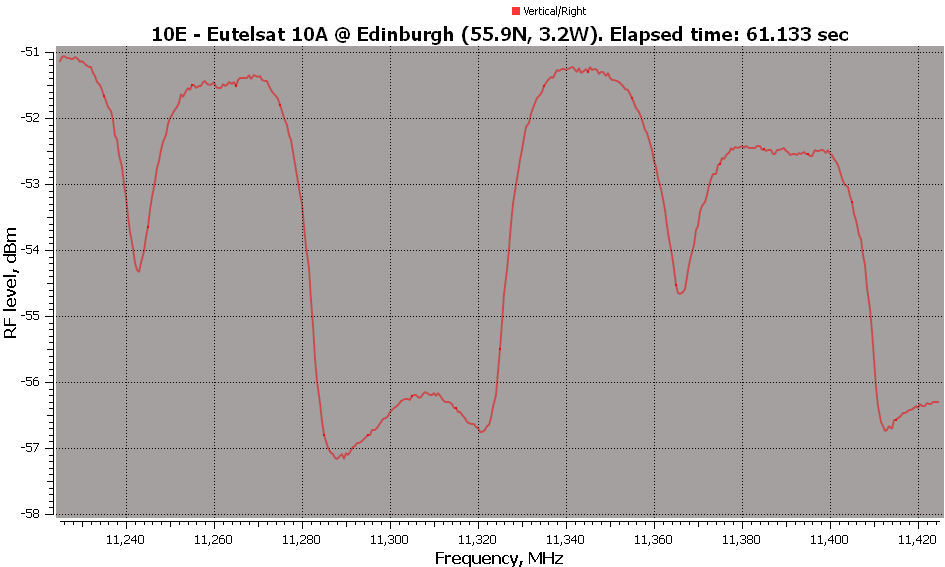
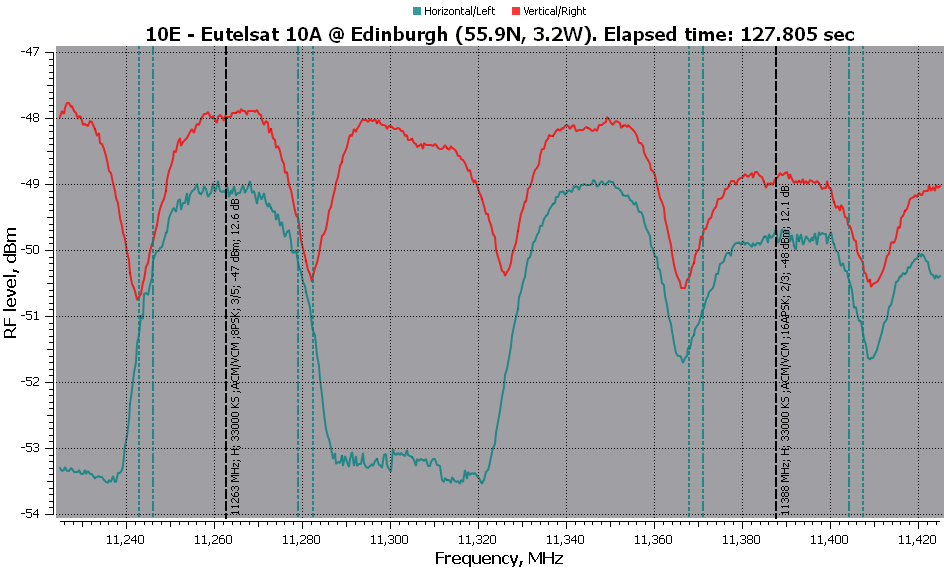
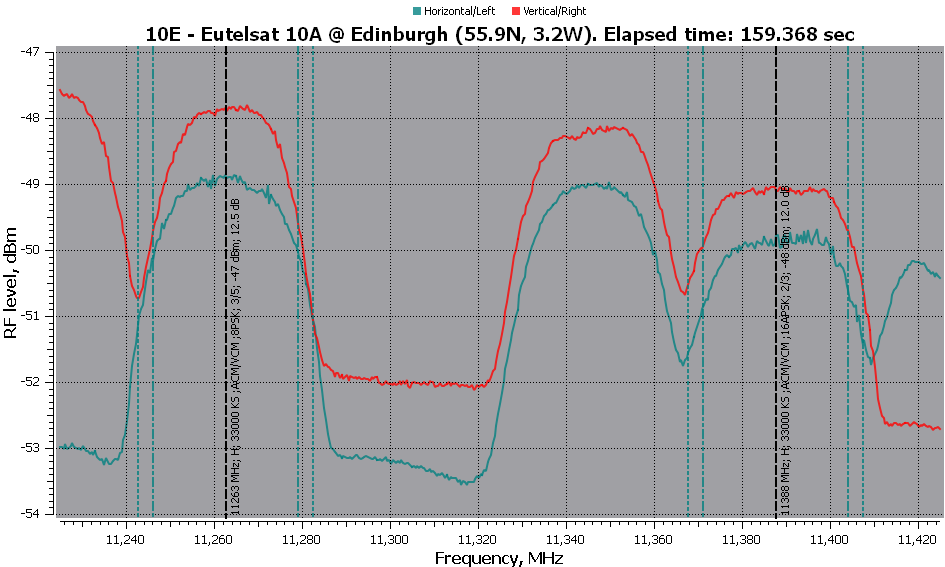
Comparison of horizontal and vertical polarisationThe drop in SNR on transponder 1 raised the question of whether the skew on our LNBs was set correctly. To check this I used my second TSB5925 to scan the same frequency range as above but with horizontal and vertical polarisations. Here are the plots with the horizontal plot shown in cyan and the vertical in red:
Discussion of the resultsAt first I did not believe the results. There is so much similarity that I thought the polarisation hadn't been changed between the plots. However, I then noticed that (a) the Ayecka SR1 was showing out-of-lock, and (b) that the transponders at the beginning and end of each trace were very different. The results seem to suggest that the vertically polarised signals are about 0.5 dB greater in strength than the horizontally polarised ones, but more importantly that for each of the EUMETCast transponders on 10A there is also one operating with the cross polarisation on exactly the same frequency! Is this really how satellites are normally planned? I am also puzzled by the 11,312 MHz peak. I had initially wondered whether on the horizontal plot that peak might have been a cross-polarised signal, but in that case why is its amplitude so similar on both polarisations? Are the results correct?Quite frankly, I am very doubtful about these results. If the transponders at the extreme ends of the plot were not different, I would just say that the polarisation hadn't switched. But if it hadn't switched which would the Ayecka SR1 have gone out of lock? I would very much appreciate comments from those more in-the-know than me! Note on the methodI did have one issue during these tests. I initially fed the LNB channel out (one of four) directly to the TBS5925 so that it could control the polarisation directly. However, when I did that CrazyScan showed no output from the TBS5925 at all (~-80 dBm). I then tried the BDADataEx program and that cause the 32-bit test PC to crash (not unknown for the TBS software, but unusual with BDADataEx). As this was a second-hand TBS5925 I am now wondering whether the satellite DC and 22 KHz parts have been damaged, although on further testing the output does show 19V on the DC feed from the TBS5925. Because of this problem I abandoned that method of testing, and reverted to the configuration which I normally use with a splitter allowing the Ayecka Sr1 to control the LNB and with a DC-blocked feed to the TBS5925. I then tried with the Ayecka in its normal configuration (18V for horizontal) and then 13V for vertical. As both plots from CrazyScan would then be the cyan colour which would have been confusing, I used PaintShop Pro to alter the cyan plot to red, and hence approximately match the colour of the "Vertical/Right" graph title. This takes a little longer than using just the TBS5925 should, but I had no choice. If I can stand the crash/reboot cycle again (the only times I've seen a blue-screen crash with Windows-10 has been with the TBS software) I may investigate this further. Polarisation - continued2017-09-21-1705-utc 2017-09-22-0435-utc Single Cable operationYou need to install the software from "Crazy Cat". It's best
to ask on the MSG-1
self-help group where to get this software as the location tends to vary.
You can try: http://crazycat69.narod.ru/sattelite/DVBDataEx/bdadataex.htm
but the site is in Russian.
Note: If you are using the beta TBS6903 driver (drivers dated 2017-07-07)
you need to lock and receive HVS-1 with tuner-0 and HVS-2 with tuner 1, because
they have different-sized packet buffers (64 packets for tuner 0, and 16
packets for tuner 1). An oddity - don't use monitor power-down!In late 2021 I needed to re-install Windows-10 on the PC which had been running correctly for some years. This fresh installation had the oddity that the screen power timeout needed to be set to "Never" otherwise one of the two tuners started generating TelliCast errors. Following a conversation with Ernst Lobsiger:
Arne van Belle had suggested some new process running when the issues started, but I
could not see a obvious change in CPU, network I/O, or disk I/O. Using a second USB boxFollowing a question from Ian Deans, I checked whether it was possible to use a second USB box to allow separate reception of HVS-1 and HVS-2, or perhaps separate reception of HVS-1 and the BS so that low-signal issues with the HVS-1 don't cause data loss with the BS (se the devices to receive only the relevant MODCODs). The steps are very similar to those above, running the addtap.bat command script supplied with a BDADataEx installation. I tested by adding a TBS5927 to an existing TBS5925 box on a Win-10/64 tablet PC. The LOOP OUT of the 5925 was connected via a short cable to the LNB IN socket of the TBS5927. I only checked that basic data reception was possible, and didn't try two TelliCast instances.
Current statistics |
|
|