|
The MODIS L1 Viewer allows you to visualise either image or fire
data from the MODIS satellites (Aqua and Terra) from the Internet or the 1km
resolution data sent over the EUMETCast system (you will need
to register with EUMETSAT to get this additional data, but it is free). My
MSG Data Manager program is recommended to copy the
EUMETCast data into a date-named directory tree and manage the removal of older
data. The MODIS data
is sent in 5-minute segments, and the program allows you to combine multiple
5-minute segments from the same pass to produce a larger regional image. Both the
raw data, and several derived false-colour images are available.
|

(Click for a larger image)
|
|
From the MODIS L1 Viewer version 3, you can also use 250m, 500m or 1km resolution data downloaded from
other site, and you can can produce your own false-colour combinations from either
visible or thermal bands. Because of the much larger size of this
data (up to 44 Megapixels and greater), image combining is done in your
own image progressing program.
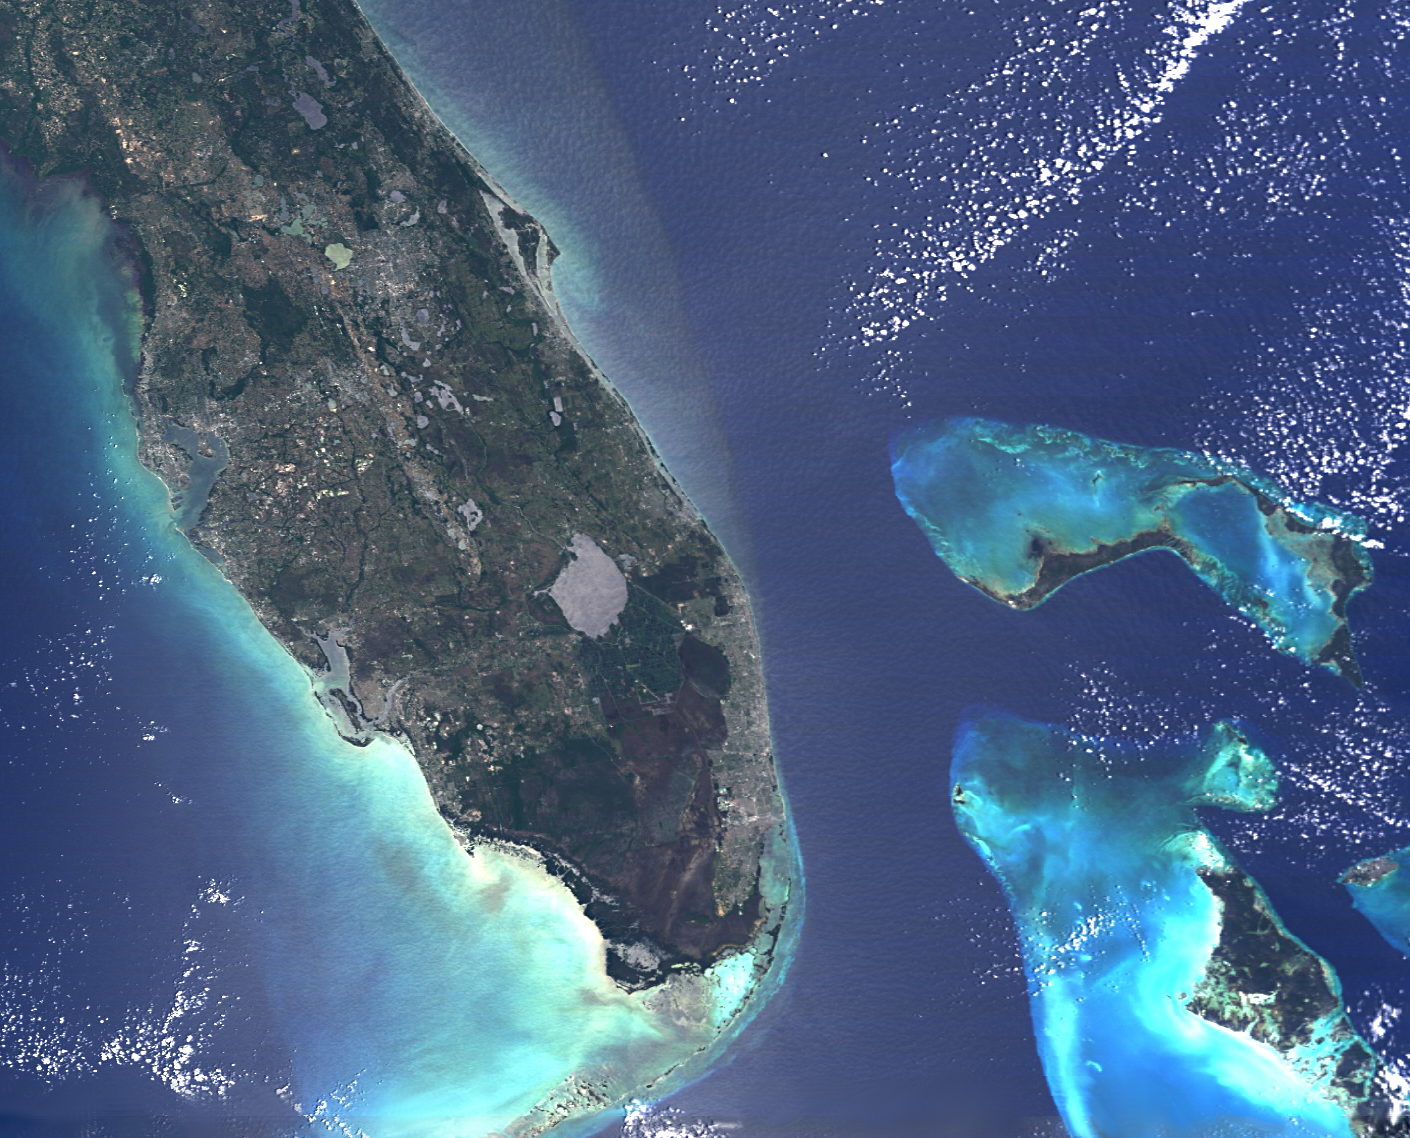
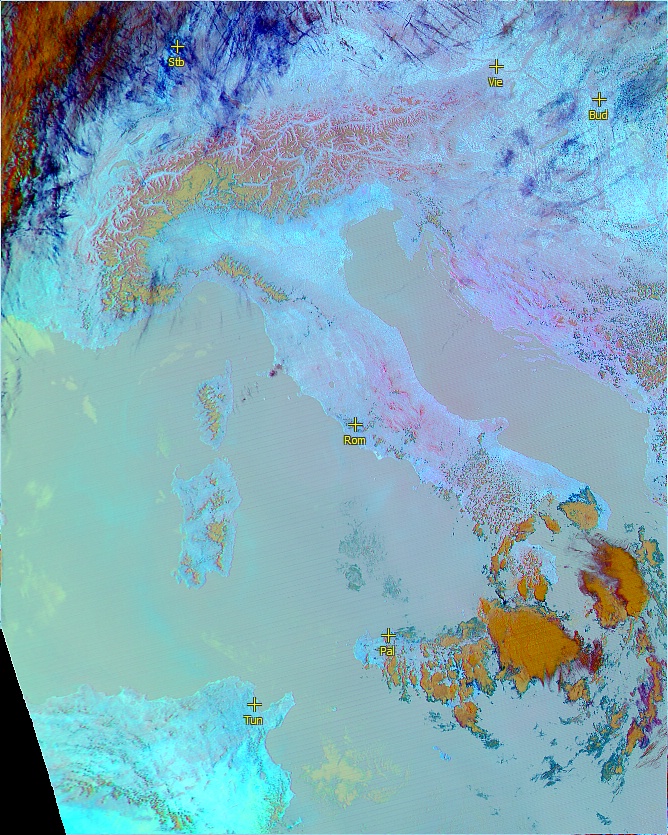
Here is an example of LAADS data at 500m resolution, which contains the
seven visible bands sensed by the MODIS imager. James Brown has
kindly provided this example of false-colour combination using band 1, 3
and 4 to illustrate the features of the seas around Florida. Click
the thumbnail for a larger
image. |
Program Functions
Browser view
|
(Click for a larger image)
|
|
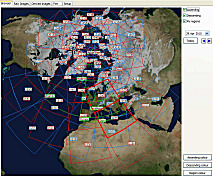
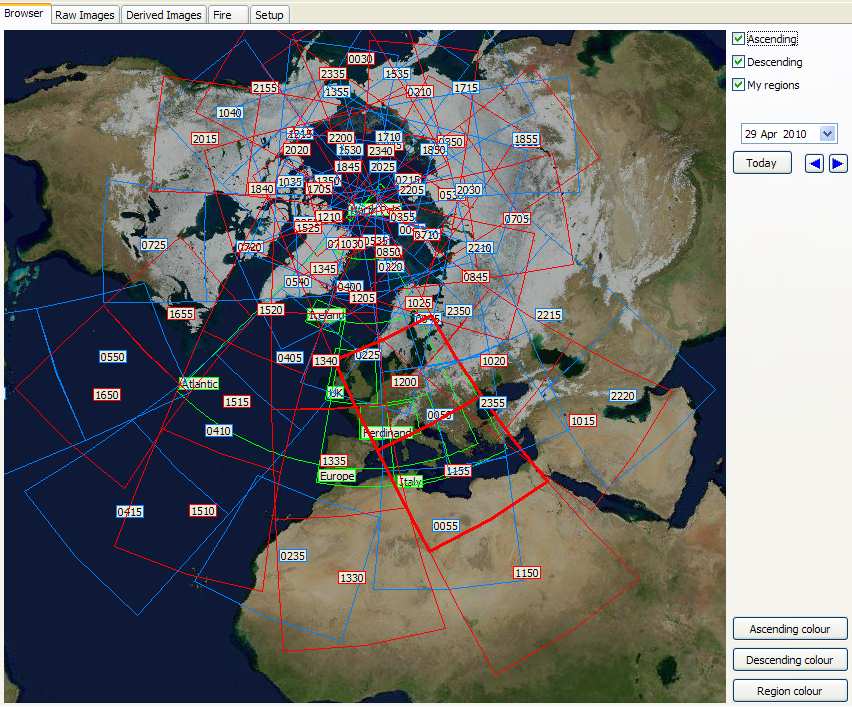
The Browser tab provides a graphical display of all the
data available for a particular date, allowing easy selection of a segment
to be processed. Ascending and descending passes are shown in
different colours, each labelled with the time of the segment.
Double-click a segment to open it for further viewing. You can also
display the user-defined regions to which data can be remapped.
Select the date and time either with a calendar control, a
"today" button, or by stepping day-by-day.
The Browser View allows you to select multiple images
from the same pass for processing as a combined pass covering more of the
Earth's surface. You can drag-and-drop file from Windows Explorer
onto the Browser tab.
|
Raw Images display
Once you have selected one or more segments for
processing, the Raw Images tab is where the data is first displayed.
There is a Geo tab to show the region covered by the pass in more detail,
and a number of tabs allowing access to one of the 18 - yes, eighteen -
sensor channels available from MODIS. There are 36 channels from the
sensor itself, of which 18 are available on the EUMETCast subset.
All channels are included in the LAADS
1km resolution downloads.
Visible channels
- 1 - 620-670nm
- 2 - 841-876nm
- 5 - 1230-1250nm
- 6 - 1628-1652nm
- 8 - 405-420nm
- 9 - 438-448nm
- 10 - 483-493nm
- 12 - 546-556nm
- 15 - 743-753nm
- 26 - 1.360-1.390µm
|
Thermal channels
- 20 - 3.660-3.840µm
- 23 - 4.020-4.080µm
- 27 - 6.535-6.895µm
- 28 - 7.175-7.475µm
- 29 - 8.400-8.700µm
- 31 - 10.780-11.280µm
- 32 - 11.770-12.270µm
- 33 - 13.185-13.485µm
|
Right-clicking any of the images allows you to:
- Add boundaries.
- Display the North Pole.
- Select a user-defined region to which to remap the data.
- Change the brightness of a visible-channel image.
- Zoom in or out.
- Save the displayed image, either with or without
horizontal geometric correction.
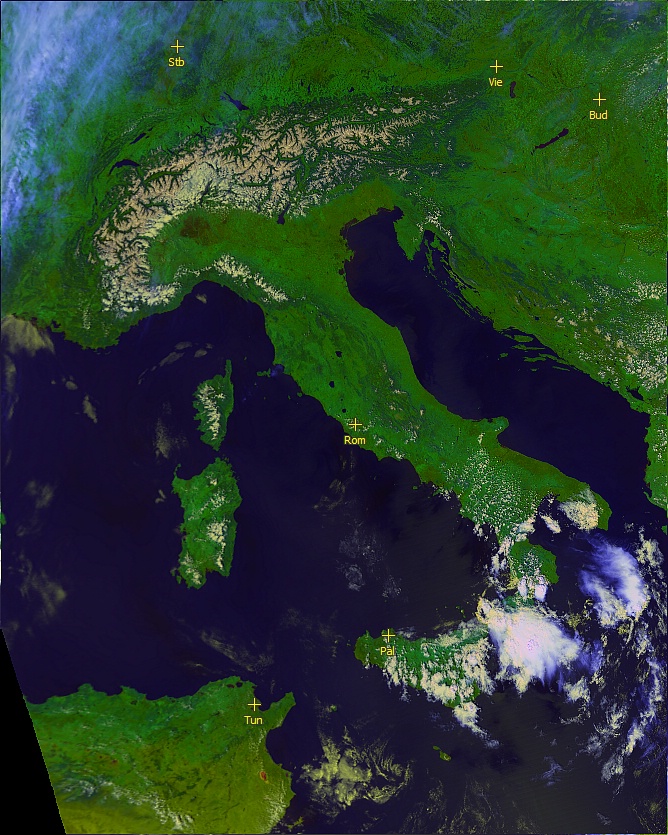
Derived Images display
The Derived Images tab allows access to a variety of
channel combinations designed to bring out various environmental
parameters based on physical characteristics of the atmosphere and
land. In the first release, the following are provided, and it is
expected that more will be added as the program is developed:
- RGB - colouring resembling the classic RGB421 display
from NOAA AVHRR data.
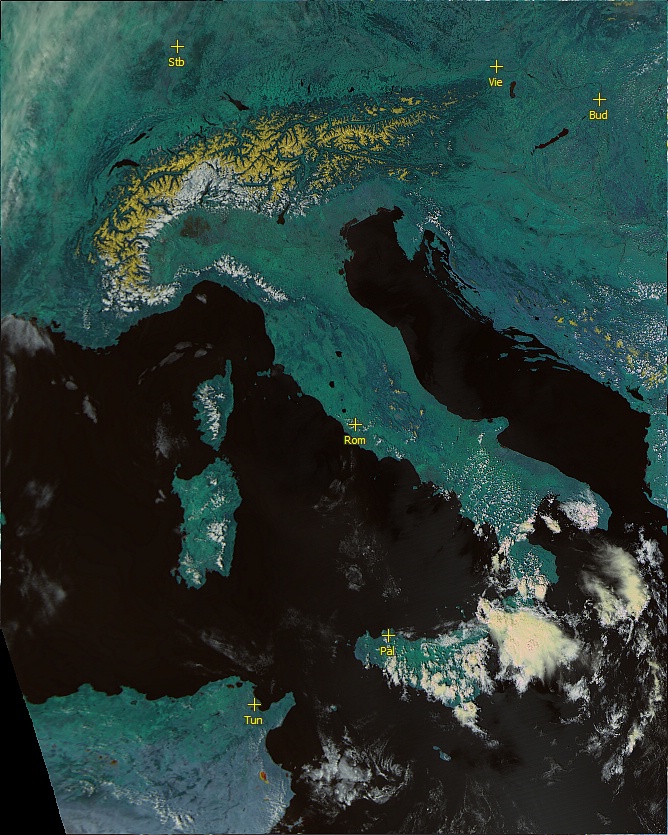
- RGB521 - experimental colouring to bring out snow.
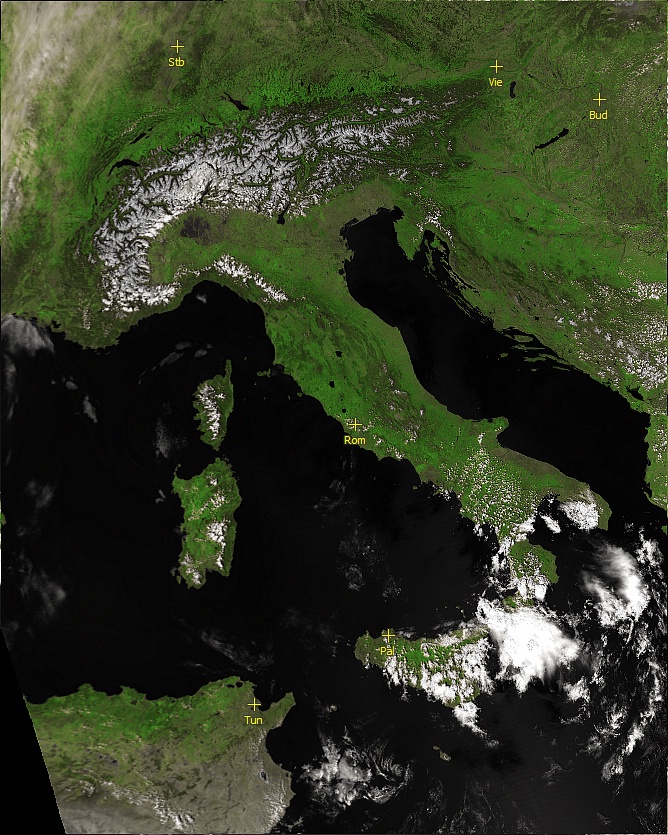
- Vegetation - vegetation index derived from channels 1
and 2, with the vegetation coloured green.
- Air mass - derived from the thermal channels to show
bulk atmospheric characteristics.
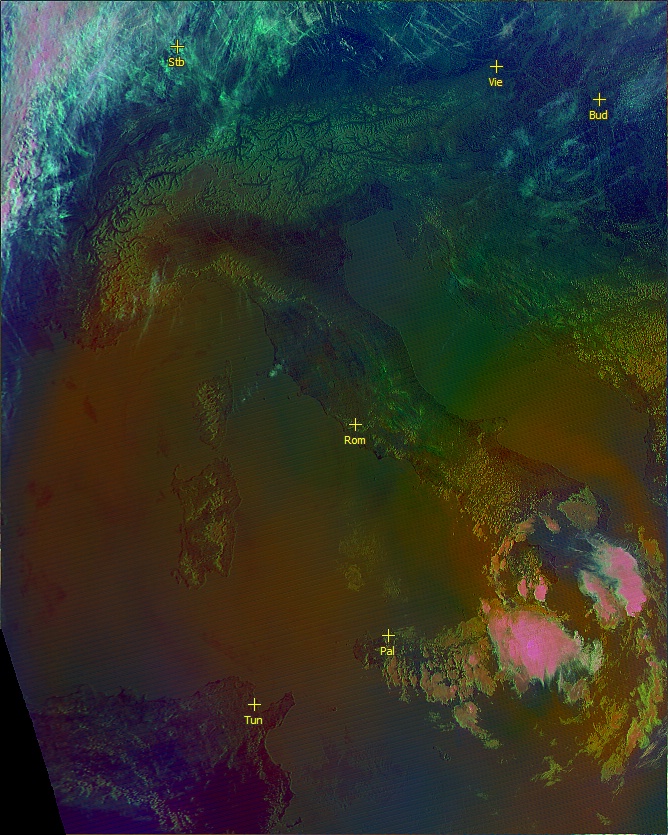
- Ash - derived form thermal channels processed to emphasise
ash and dust. Also shows aircraft trails as dark lines.
- User-defined visible and thermal channel combinations.
Similar right-click options are available. Here are some
sample images, with even the large images shown at 2km resolution. The
MODIS L1 Viewer allows you to interpolate the images down to 250m resolution,
64-times greater than the images shown. Click any image for a larger view.
Even higher resolution is possible with LAADS data, the program offering down to
125m resolution on user-selected regions.
Fire
Allows for display of MODIS fire data - files sent on
data channel 12 with names like: MOD14.A2010214.0115.hdf. You
can right-click the images to change the displayed area.
Setup options
The various setup options allow the selection of
boundary data and its colour, definition of the regions for remapping, and
various processing and image save options.
Can I register and what do I get?
The program includes a 30-day trial licence period to allow
you to evaluate its function. After the 30-day period, you will need to
register to continue running the program. Registration also entitles you
to technical support. Register the
MODIS L1 Viewer here.
Download the MODIS L1 Viewer
| V3.0.2 |
Add support for 250m, 500m
& 1km resolution LAADS data (allows use of world-wide data you
download from this
site, extend File|Open dialog to include LAADS file names,
support drag-drop of one or more LAADS files, support files on the
command-line), user-selected RGB support for combining visible or thermal
channels (10 settings), add reading a whole directory of fire files
parameter: -fire:<directory-name> (supports many command-line
options, plots cities, background image named FireBackground.jpg
supported), option for world map view in browser, option to bypass new
file scanning on startup, setup option for EUMETCast channels or all
channels - a program restart is required, support for GSHHS 2.2 and MapGen
boundary data, add support for local boundary data which is specified by
the environment variable BOUNDARY_DATA, substantial command line
enhancements being developed.
|
| V3.0.4 |
Support mouse wheel to scroll the images, more warnings
when some channels not present, area acceptance limits for batch mode
(values from Setup or batch-commanded region number, data-deficient passes
not saved), recognise 250m and 500m files in batch mode, improved support
for orthographic projection in northern regions, where large longitude
spans are needed, some protection against non-HDF files, correct 125m
scaling.
|
| V3.0.6 |
Improved choice of multi-segment pass direction when both
ascending and descending are in the set, add experimental blue-bias option
in user-RGB mode - proof of concept, avoid browsing hidden directories.
|
| V3.0.8 |
Add two Internet pass-browsing sites in new View menu, add
choice of line widths for coarse & fine boundaries, recognise
directory with no trailing "\" as parameter, enhancements to
allow derived views when multiple chunks have both IR-only and IR/Vis
channels (available on visible channels in raw view and on derived views
including vegetation), French language update.
|
| V4.0.2 |
Add German language option, press Shift|Today to inhibit
browsing, add -BOUNDARIES command-line option when saving an image from
the command-line, make saving of near-empty remapped images optional,
enhanced in-region check for partial images.
|
| V4.1.0 |
Set
up/down text colour to blue for blue channel, prevent one variable not
being initialised, more choice in the File, Open dialog, accept
"Australian" MODIS file names. Faster start-up, enter your
licence key as User, not Administrator, you may need to request a new
licence key.
If you don't have a MODIS L1 Viewer 4 key, contact me for a fresh licence
key before using this software.
|
Other goodies to download
EUMETCast updates
There are changes which you might need to make to
your EUMETCast configuration:
Enable data channel E1B-TPC-6
For the MSG Data Manager, add lines to your recv-channels.ini such as:
[channel]
name=E1B-TPC-6
target_directory=received\EUMETSAT_Data_Channel_8
The exact location for the received data may be different for
your system.
For the MODIS fire data - enable data channel ?
To be determined!
MSG Data Manager settings
Old information - may need to be updated! If the received data for channel 4 is in the "received" directory
tree as shown above, the only change in the MSG Data Manager will be to got to
Setup, Channel Selection, Other-2, and in the MODIS L1/L2 data box, check both
Manage MODIS L1/L1 and Copy M02 sensor files. You may also like to set a
value for the Data retention box to non-zero so that the MODIS data can be
automatically deleted after a certain number of days.
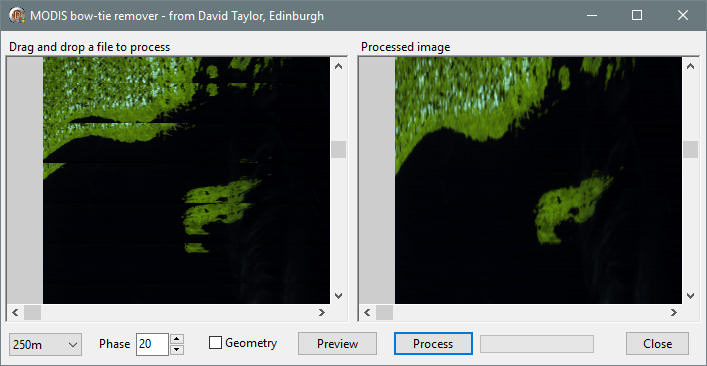
If you have downloaded MODIS images from the Web site, you may
have noticed that there is an apparent duplication of data at the edge of the
image, and that the images are not corrected for the variation in resolution
between the centre and edge of the image. To correct these defects, I
offer the unsupported Defrag MODIS program.
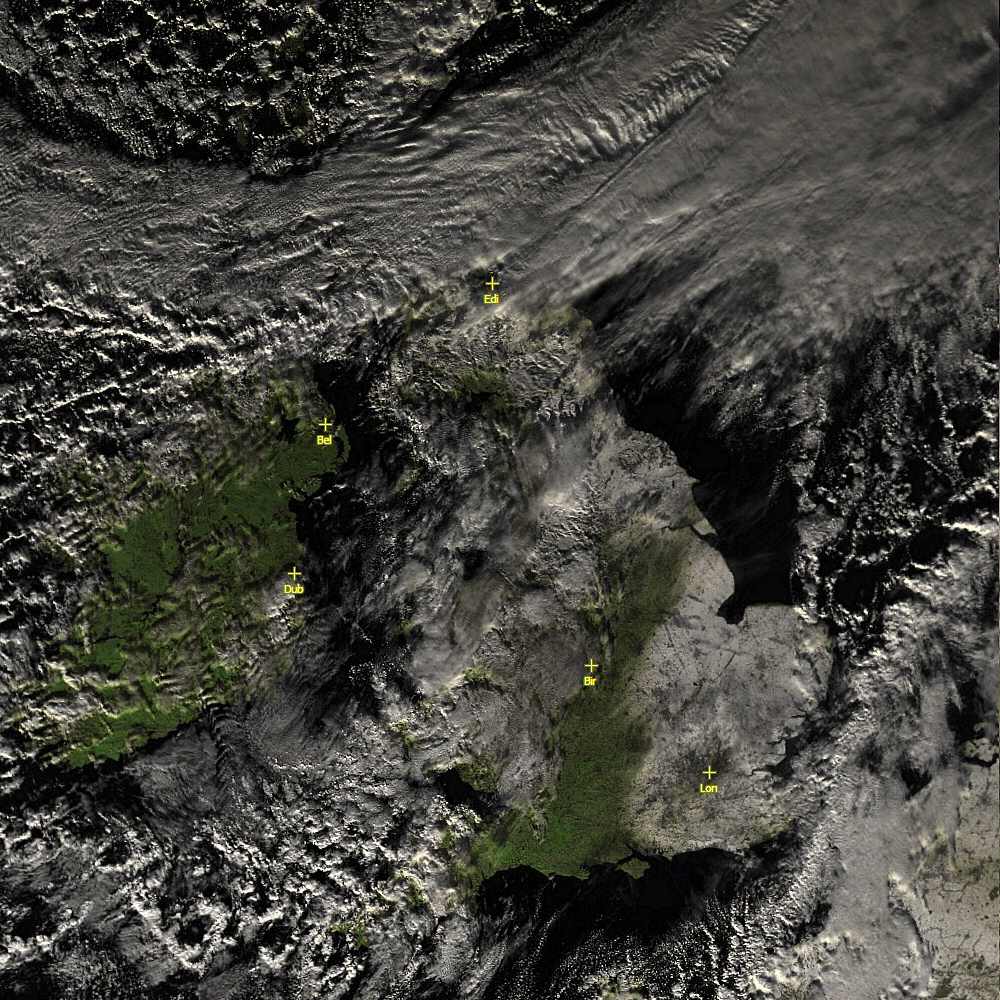
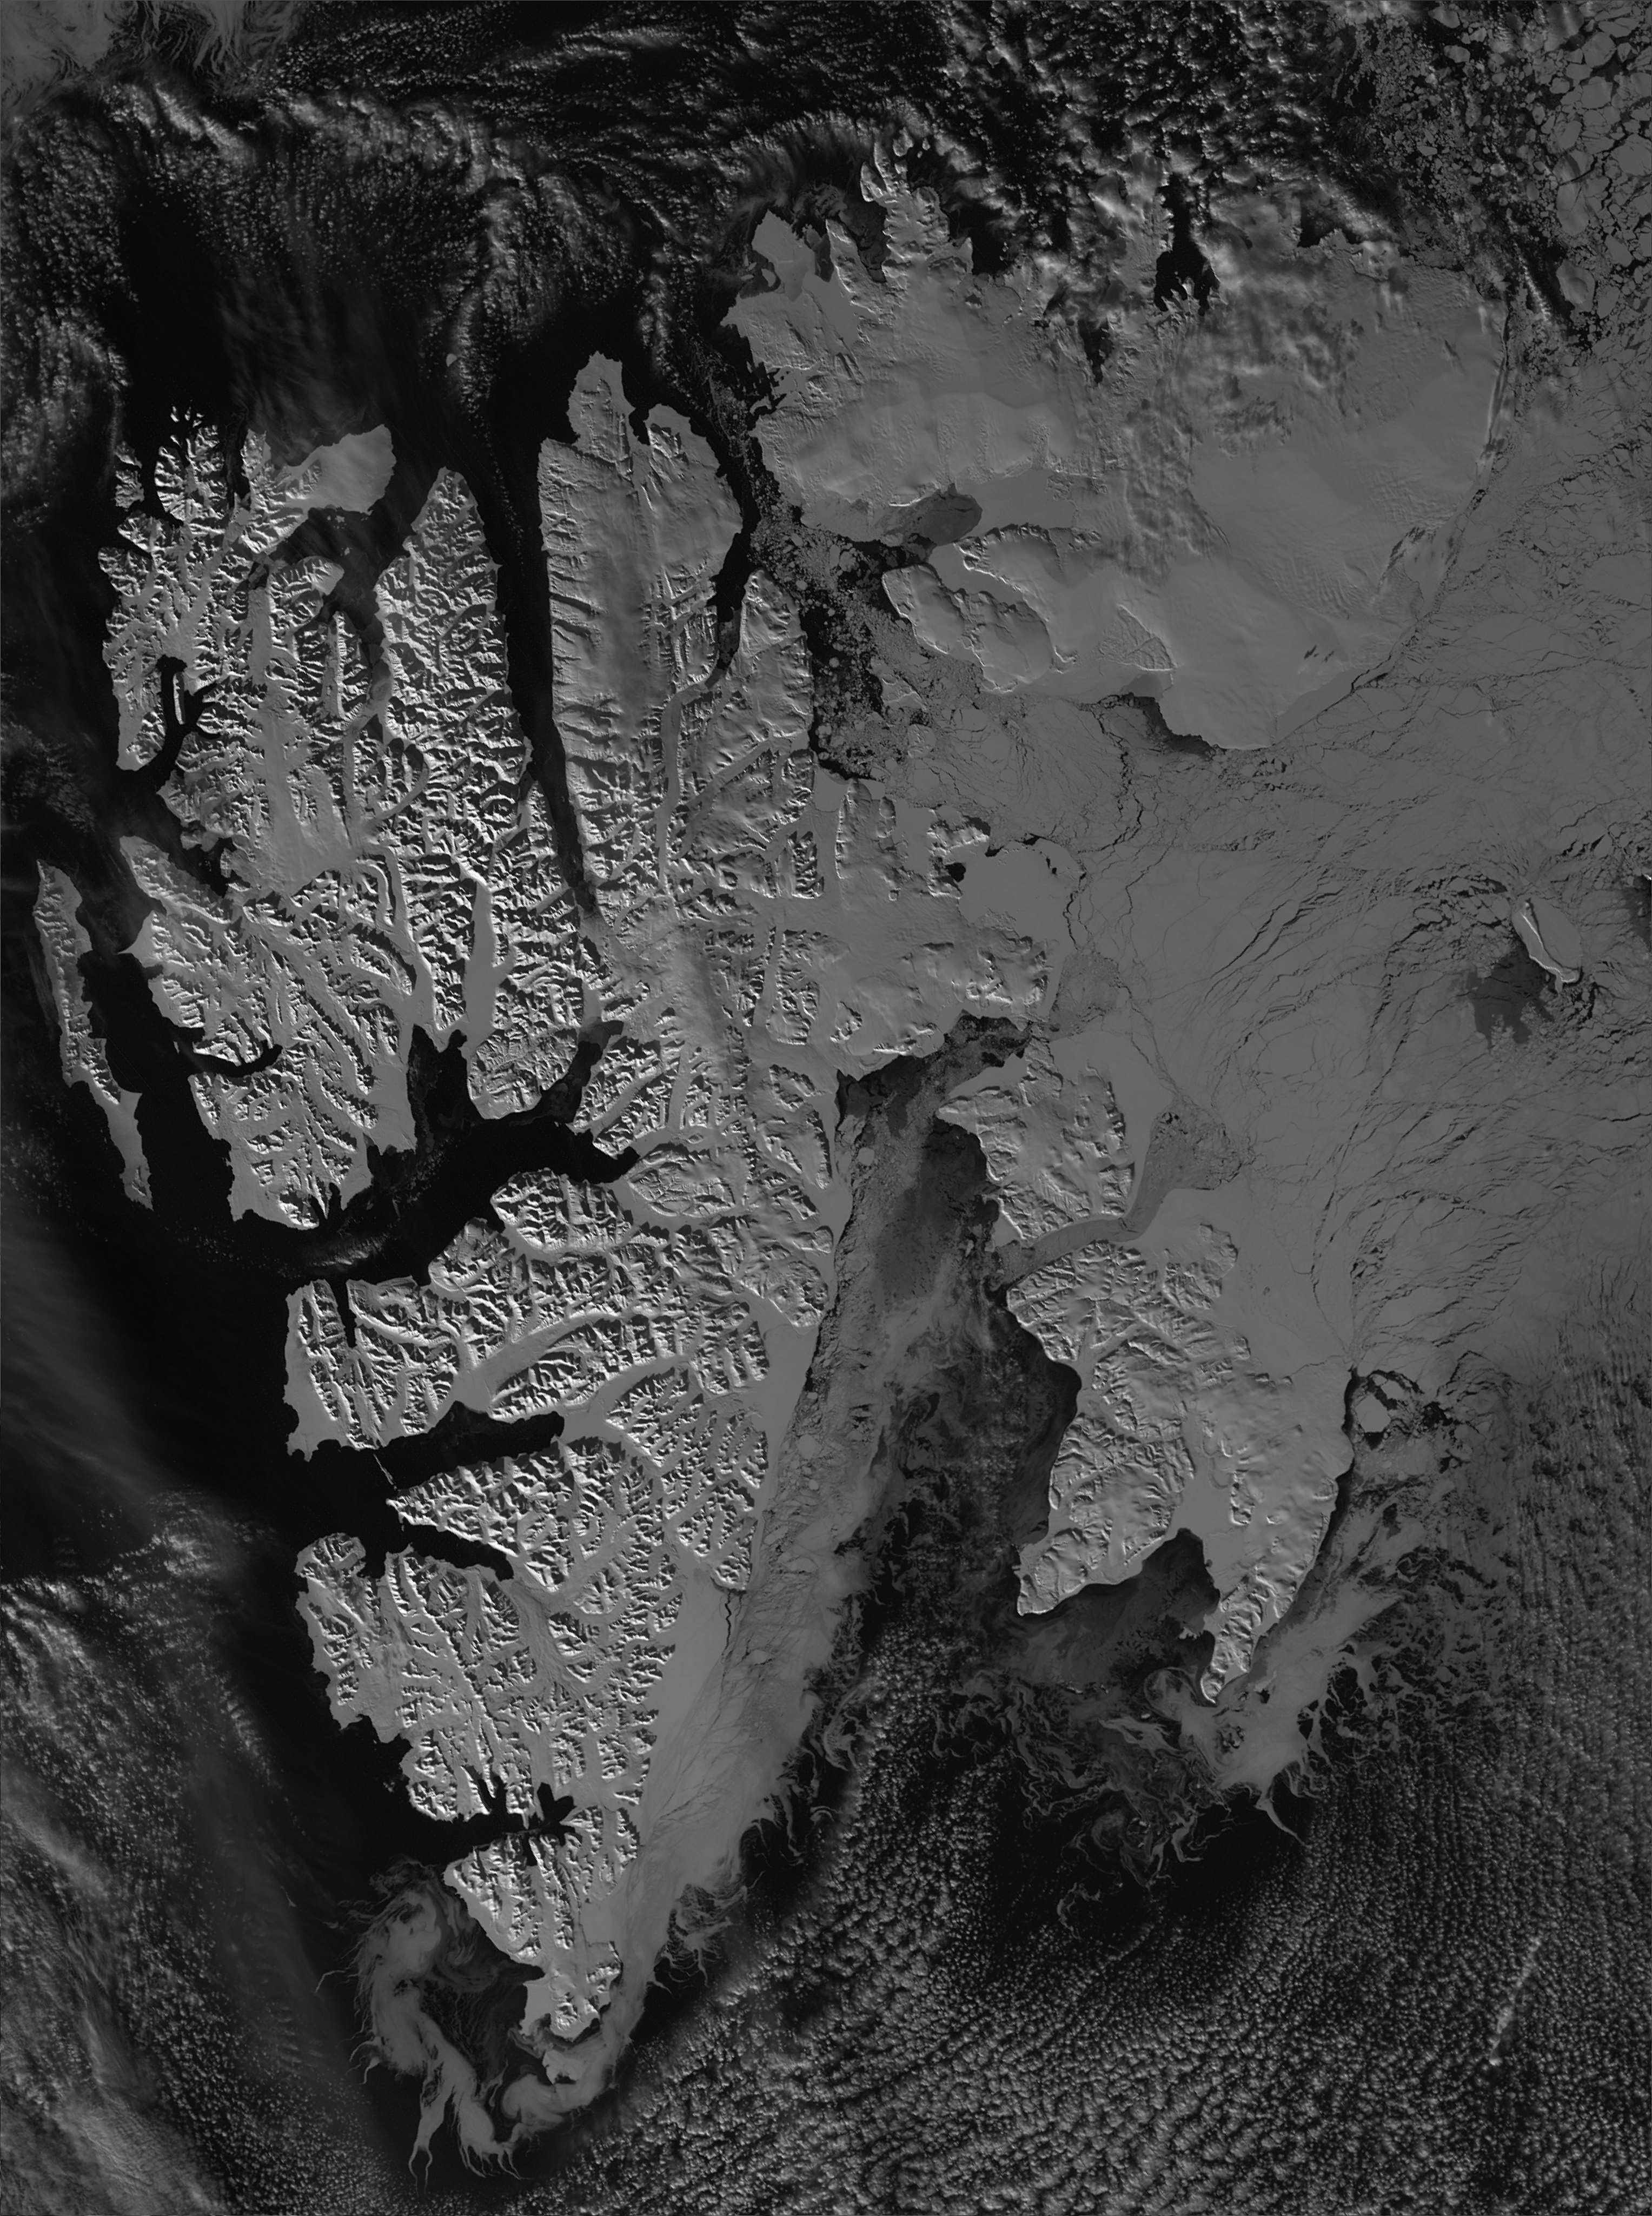
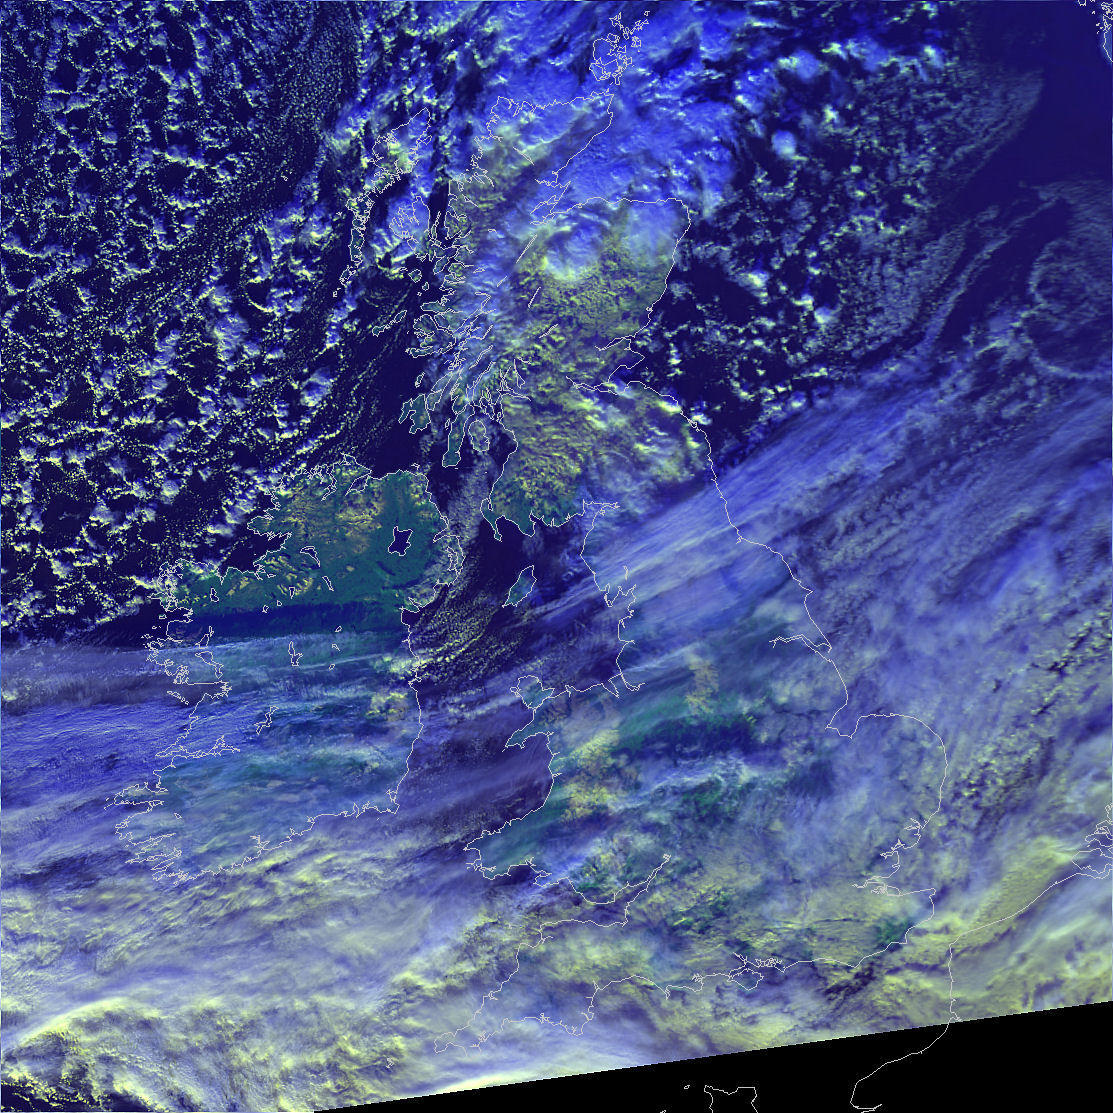
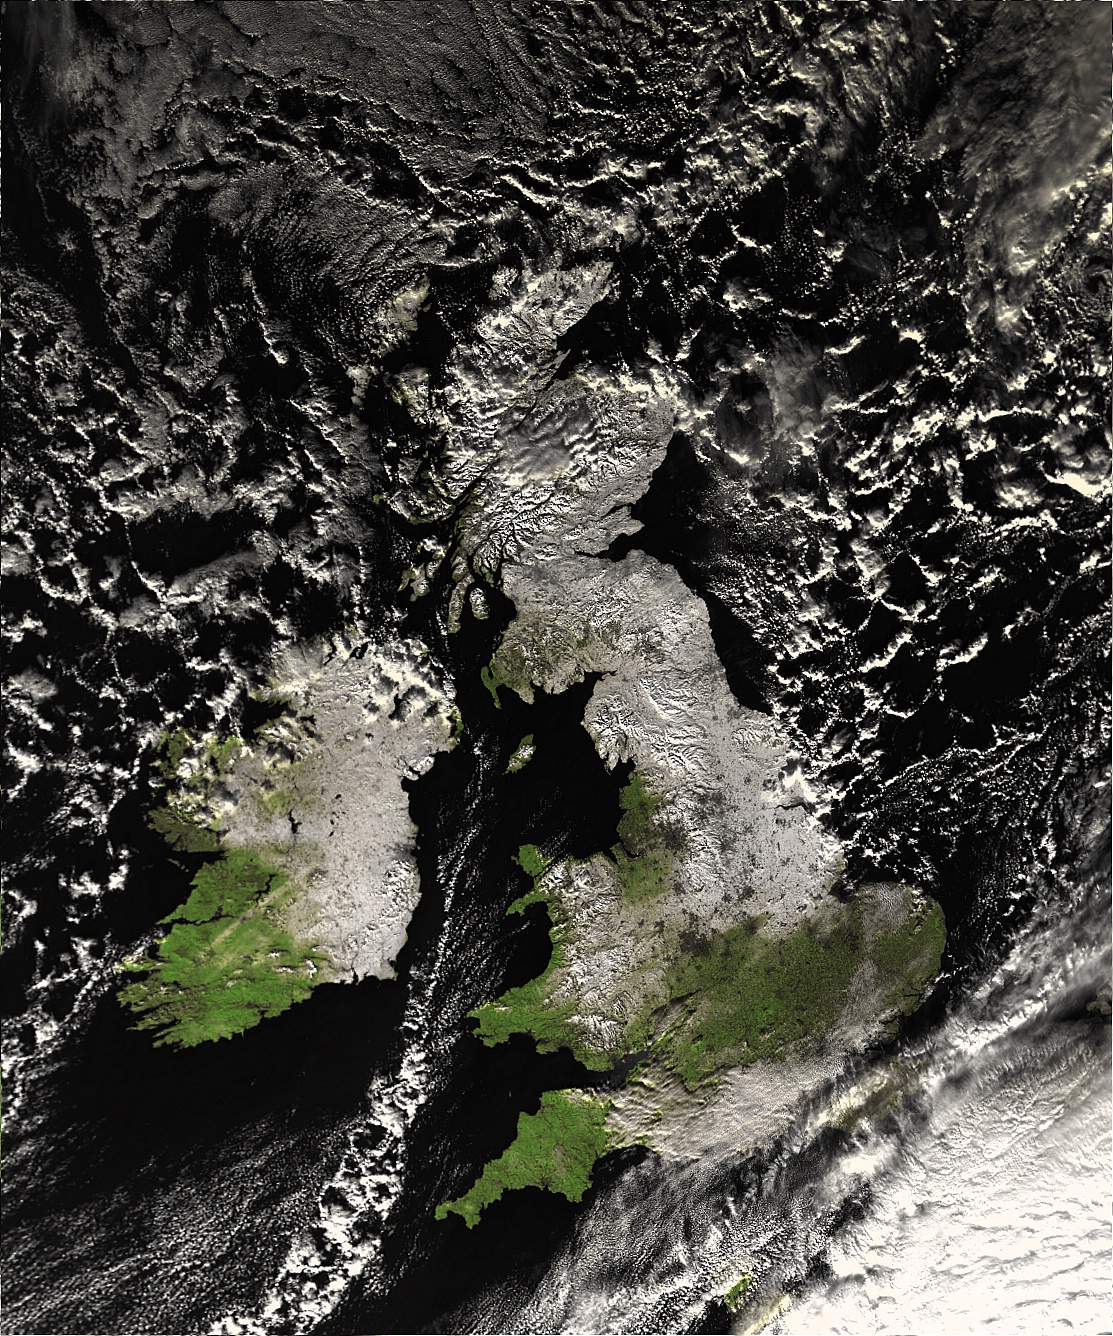
The snows of early December 2010 when, on Monday December 6th, much of
Central Scotland was brought to a halt by heavy snow showers, on top of previous
snow compacted to ice. Temperatures were not above freezing for days
before and after. Here the Vegetation mode of the program has been used,
together with the the brightness adjustment for vegetation added in beta
1.0.5.83.
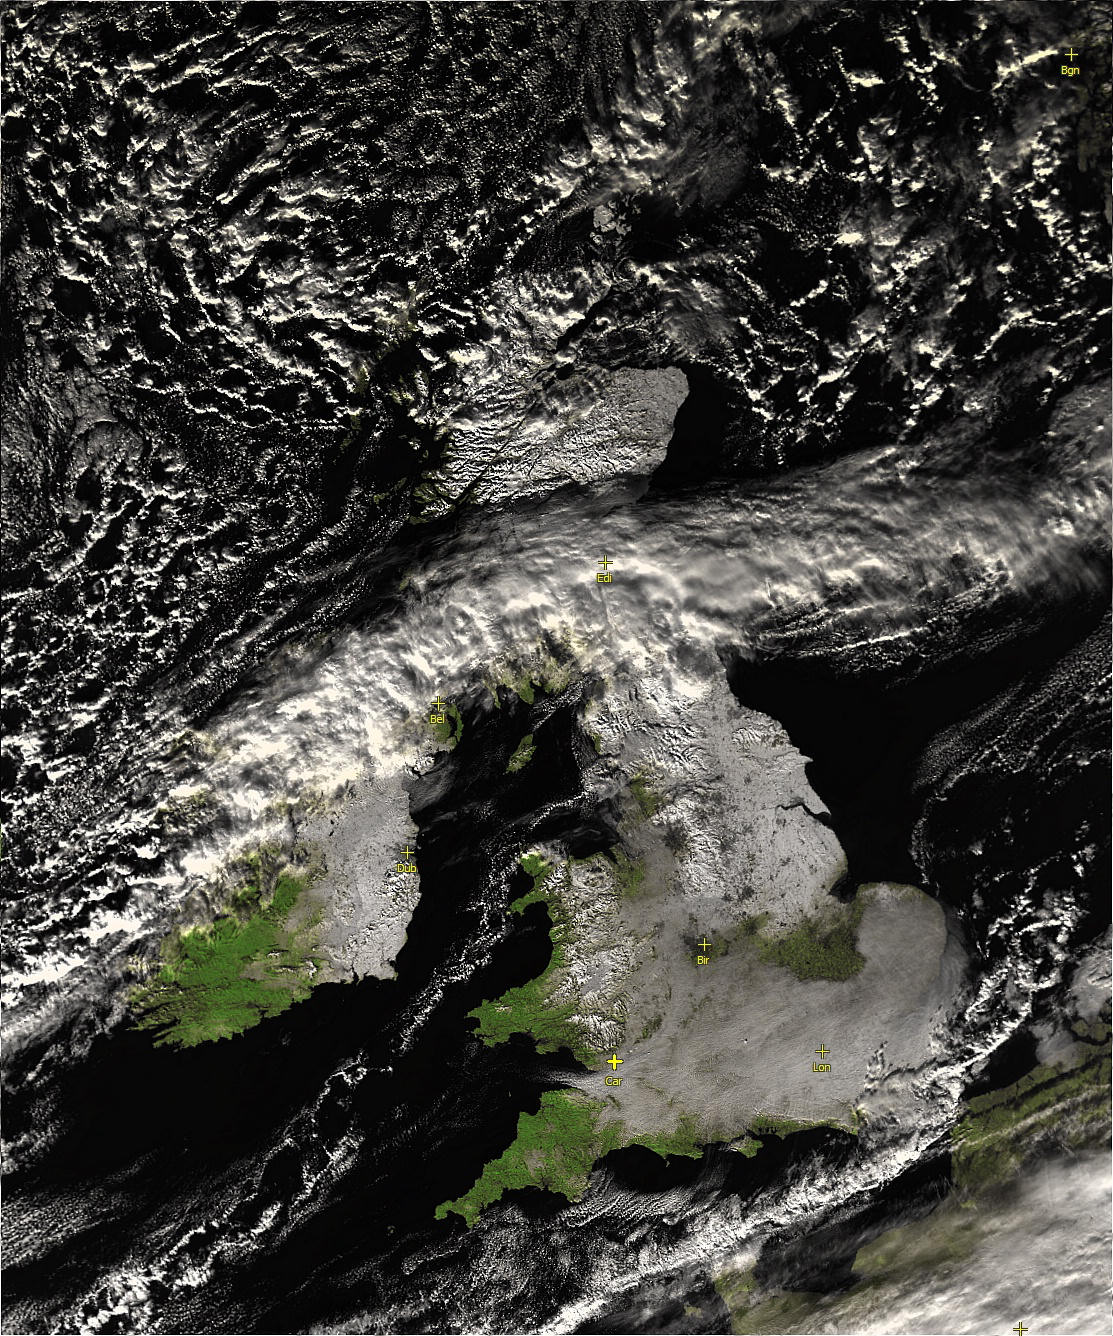
Here's another
image from Wednesday, 2010 December 08 - both images copyright 2010
NOAA/NASA/EUMETSAT etc.
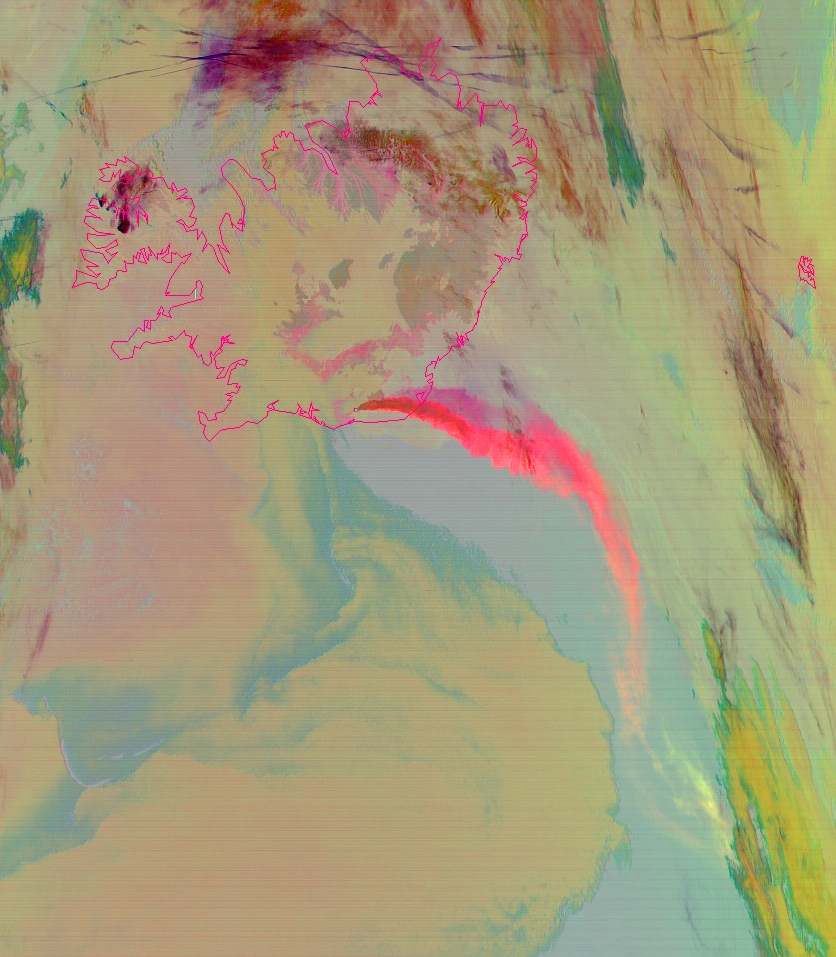
Here is an example of the program processing multiple thermal
channels of data to highlight the volcanic ash from the eruption of
Eyjafjallajokull in Iceland in Spring 2010. The ash shows as a bright pink
band in the image below, and you can also see aircraft "contrails" in
a darker grey colour to the north of Iceland. Note that the colour can
vary according to the nature and concentration of the ahs, so use care when
interpreting such an image. This image is one of many you can find on James
Brown's splendid Ash Web page. © EUMETSAT (2010). This MODIS
image was taken 0410 on Thursday May 6th 2010 - click
for more like this.
|


