


|
|
EUMETSAT MSG RSS 5-minute Rapid Scanning Service
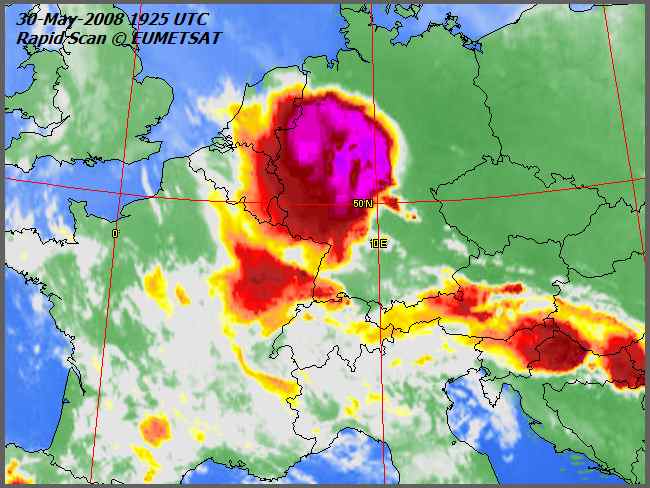
This animation was made by my GeoSatSignal software, which allows rectification of the oblique satellite view into a more natural projection (orthographic here). It shows storms developing and travelling north across Germany on 2008 May 30. Sadly, two pensioners were killed clearing up after these storms. The animation was produced by my GeoSatSignal software, and has been converted to MPEG-4 reducing the original 156MB animation to a more reasonable 4.2MB download, which is in DivX format. If you don't already have the free DivX player, you can download it here. For best results, I suggest you right-click here, and select Save As to copy the file to your computer for playing. The animation was made from EUMETSAT data (© 2008) by my GeoSatSignal software.
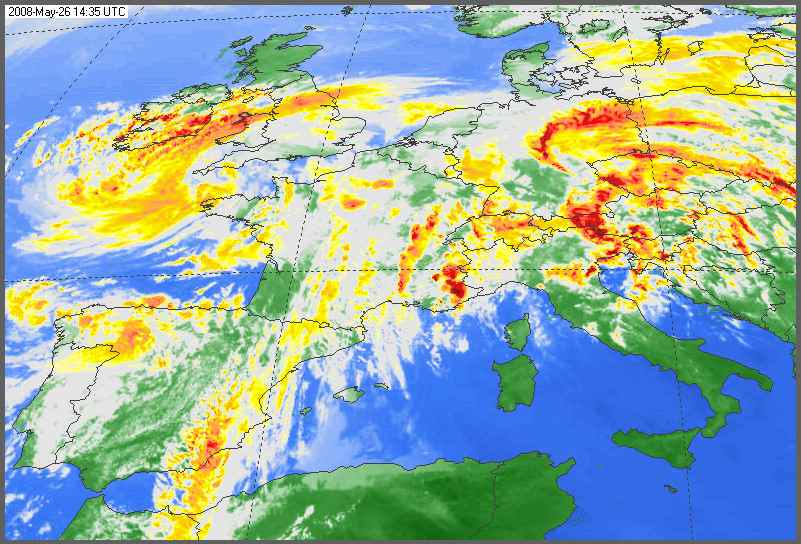
This animation was made from the recently launched MSG RSS (Meteosat Second Generation Rapid Scanning Service) which uses the backup Metoesat-8 satellite located at 10 degrees east to provide a new image over northern Africa and Europe every five minutes. The image above is from a single frame of a 20-hour animation covering May 26 and 27, 2008. The animation was produced by my MSG Animator software, and has been converted to Microsoft MPEG-4 format reducing the original 98MB animation to a more reasonable 14MB download. For best results, I suggest you right-click here, and select Save As to copy the file to your computer for playing. If you can't play this animation on Windows Vista, try using IrfanView. The animation was made from EUMETSAT data (© 2008) by my MSG Animator software.
EUMETSAT Meteosat-6 10-minute Rapid Scanning Service
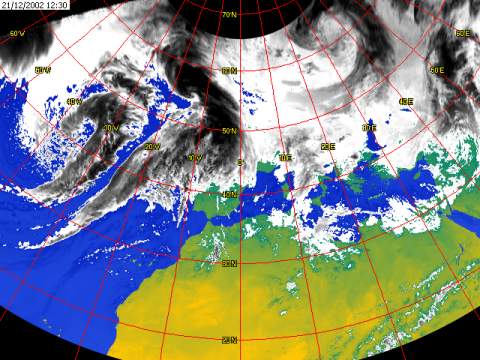
For your interest and enjoyment, here is a movie made from the EUMETSAT Rapid Scanning Service (RSS) which uses the standby Meteosat 6 satellite to provide northern hemisphere scans every ten minutes. Here the image has been remapped to a polar stereographic projection, and the infra-red channel used to make a false-colour image where the coldest cloud-tops are black, sea is blue, and land green to yellow depending on temperature. The animation covers just over one complete day, and is in Windows AVI format, compressed down to 15MB. This has made the gridlines rather peculiar, but the cloud movement is beautifully depicted.
Some of your questions answered....
Ship Trails Animation
More questions answered....
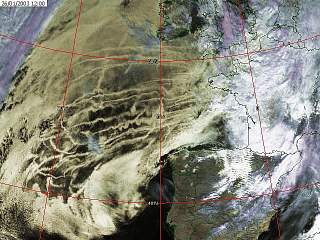
You may be interested in the high-resolution images also broadcast over the EUMETCast service. The animation was made from EUMETSAT data (© 2002) by GeoSatSignal. |
|
|