


|
|
|
| Here are some of my more recent results. Those detailed below show the capabilities of my software, but I have also provided some pictures which show how weather satellites can see natural phenomena. In particular, your can pictures from the 1999 total solar eclipse and the 2000 eruption of the Hekla volcano on Iceland. Recently, a new satellite has been launched and the two visible band channels have provided chance to experiment with deriving vegetation content. You might also like to see a rather spectacular picture of Norway by radar (Okean-O). There are examples of false-colour processing, vegetation display, interpolation, and image straightening. From the trials of the Meteosat Second Generation geostationary satellite (MSG-1) (Meteosat-8) you can also see this remarkable image of the UK and fires in southern France. Met-8 also relays data from satellites covering other regions of the earth, for example, this first ever South Atlantic hurricane of March 2004. A recent addition is Meteosat-8 results from the 2006 total solar eclipse. Pager Problems with NOAA-18NOAA have chosen to use a new APT frequency for NOAA-18 - 137.9125MHz. Unfortunately this is so close to the pager frequencies used in the UK that, at this location, reception even on an overhead pass is completely ruined. I have been handling pager problems on the other NOAA satellites (mainly receiver overload) and my efforts are described here.
SICH 1MFirst image from Sich 1M received in Edinburgh, Saturday January 29 2005 at 0812. This image is the first attempt at processing with SatSignal, and shows the unfortunate effect of a noise burst on the signal. Further processing on the interference-free part of the image does not suggest there is any data in the black parts. Previous satellites in this series has shown radar, thermal or microwave sensor data in these parts of the picture. The image is now the correct way round, with the lighter east part of the earth on the right of the image. My first posting showed it reversed. I have also been able to optimise results across the interference band by using the "Tape input" option in SatSignal and choosing a sampling frequency of 11030Hz instead of my more usual 11023Hz.
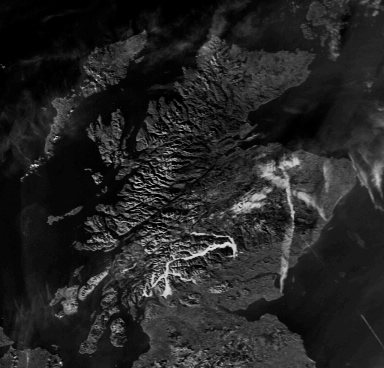
Scotch Mist?
Etna eruptionThis is an early morning picture of the 2001 Etna eruption taken by NOAA-12 at 0410 UTC on Sunday, 2001 July 22. The low angle of the sun's lighting throws a shadow of the column of gases and ejecta across Sicily so that you can see a vertical rise followed by a horizontal spread once a certain altitude has been reached. The high-level wind then blows the material to the south-east. This data is HRPT data from the Russian SMIS archive, with channels 2 and 4 forming a false-colour picture. There was some interference on the original which has been removed by Paint Shop Pro.
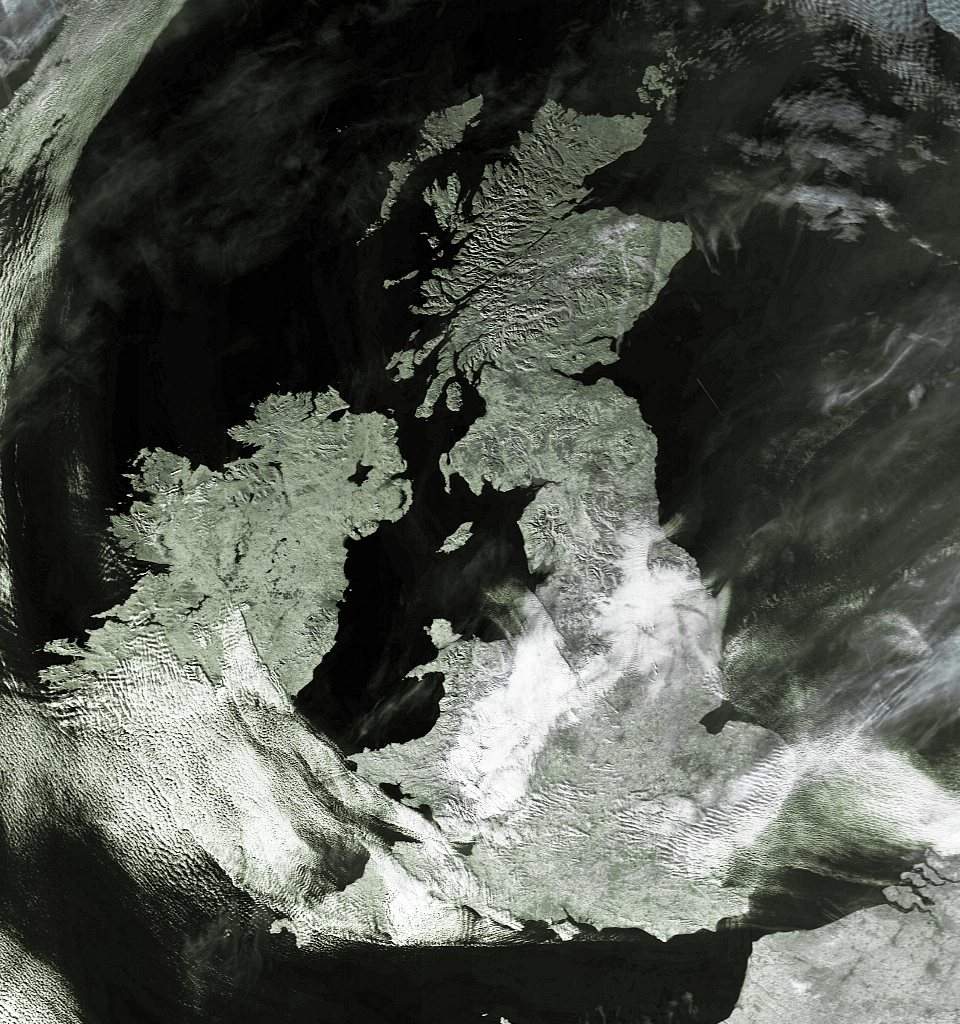
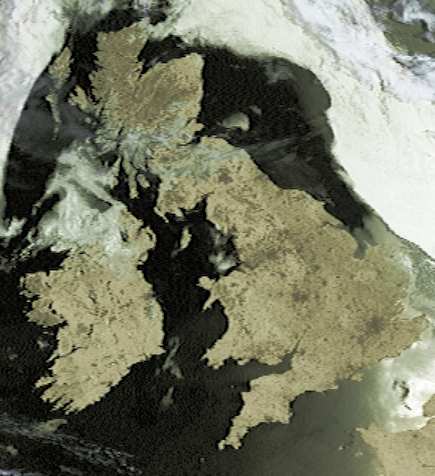
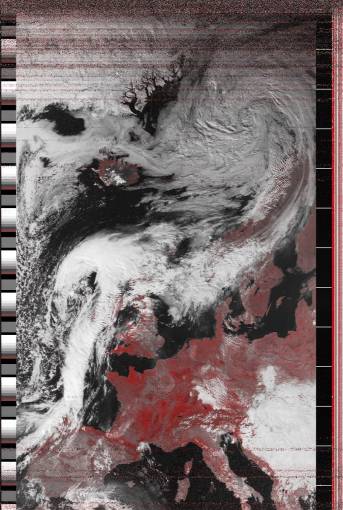
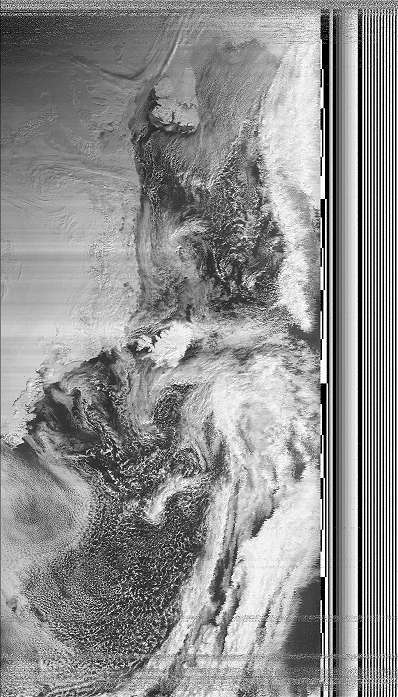
Local ImagesHere's a picture of the United Kingdom taken by NOAA-15 on 2000 July 21 at 08:37 UTC and processed by SatSignal. Whilst most of the settings were automatic, the image interpolation feature has been used to double the number of pixels in the image.
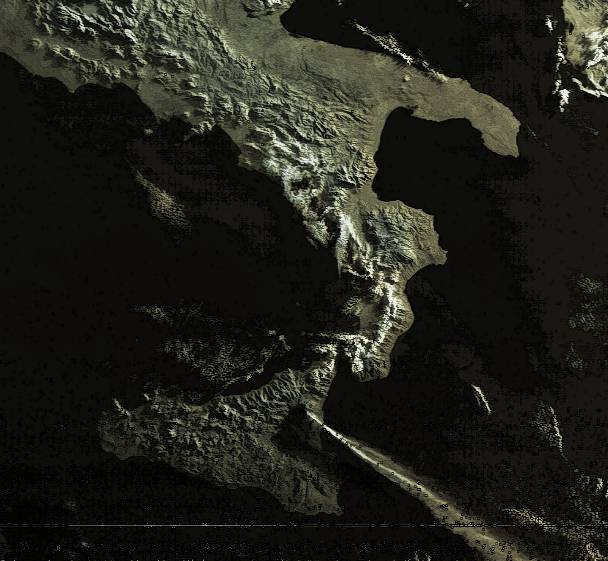
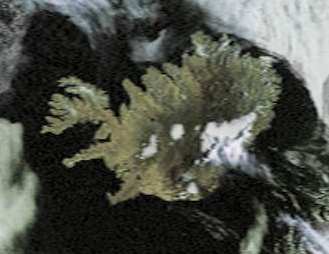
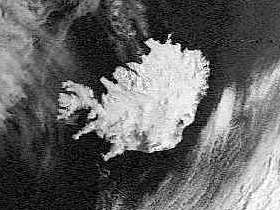
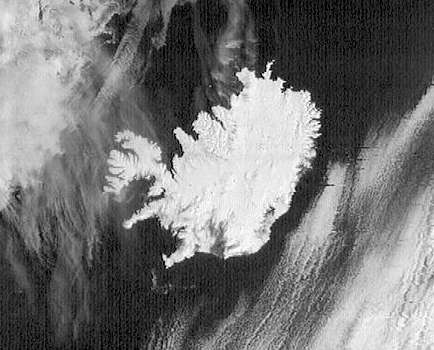
The image of Iceland was similarly processed (2000 July 09 at 09:46 UTC).
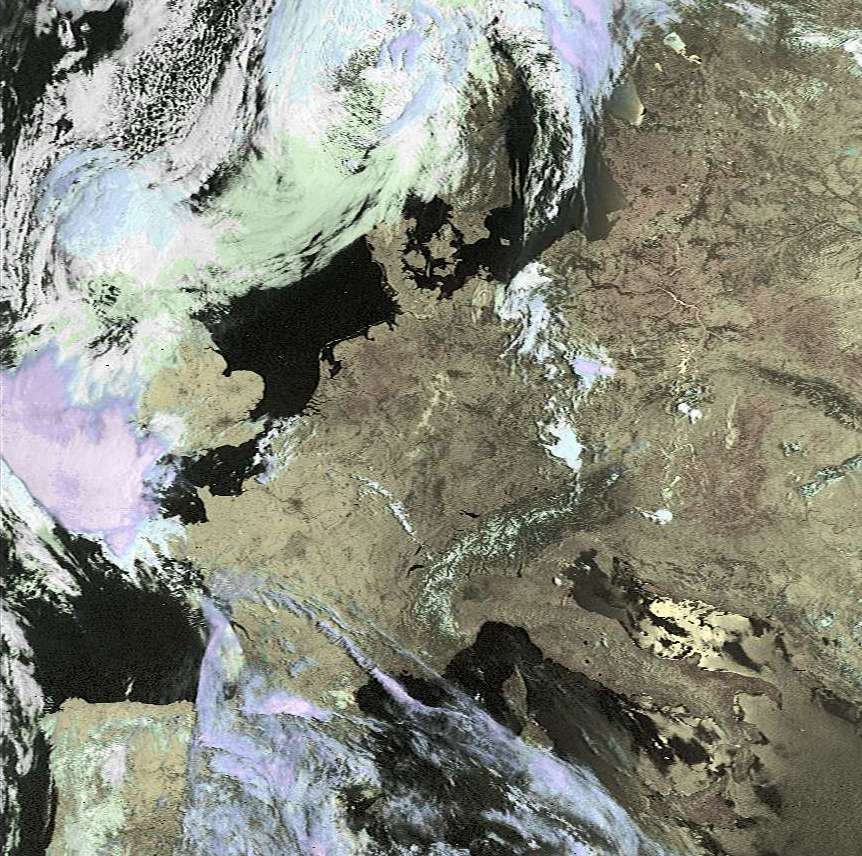
False Colour ProcessingFalse Colour Processing - modifying the visible channel by temperature information. A morning picture of western Europe (1999 May 29 at 07:31 UTC). Note the cold cloud tops (purple) to the south-west of the UK, and the gradual change of colour from green (cold) to red (hot) from the north to the south of Europe. The Alps can be seen both as some snow-capped peaks, and as a generally darker area. Dark areas round the conurbations of London and Paris, lakes in Switzerland and a warm Benelux are other notable features. If you look carefully, you can even see the Danube around Budapest and Belgrade.
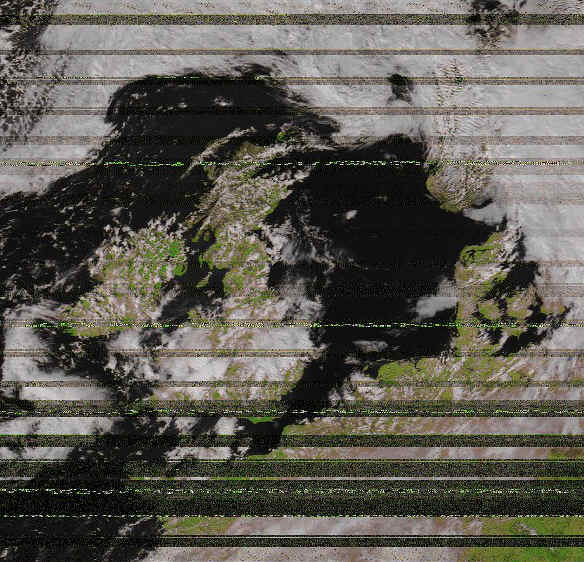
Vegetation ContentThe launch of NOAA-16 in September 2000 provided a small window of opportunity to process a signal for vegetation content. Normally, the two transmitted channels are a visible and an infra-red one, allowing colour to be added to an image based on the apparent temperature, as described above. During the test period of NOAA-16 it was instead transmitting a visible and a near infra-red channel. Because of the chlorophyll, vegetation has a higher reflectivity in the near IR channel, allowing the two channels to be processed to indicate the amount of vegetation present. In the picture below, vegetated areas are shown coloured red.
InterpolationInterpolation - getting extra information from an image. The two pictures of Iceland are full scale, and were taken within an hour of each other on 1999 April 1. The two images form an interesting comparison - they show different amounts of detail, and different amounts of noise (which looks like grain in film images). The Meteor image has been interpolated to have more pixels by SatSignal, which may make the detail easier to see. On the one hand, the NOAA image shows better contrast on the mountains, perhaps a combination of (a) the lower sun angle of the earlier picture or (b) the non-linear processing used internally in NOAA-15. On the other hand, the higher resolution is achieved by Meteor with SatSignal and its interpolation processing. The higher elevation of Meteor also produces a lower noise signal at my location, although this is somewhat difficult to see in this pair of images.
Image StraighteningImage straightening - improving on WXSat. SatSignal uses a different demodulation technique to WXSat and can therefore produce straight images from Resurs and Meteor satellites, without any residual curvature. In these images, the interpolation facility has been used to increase the resolution as well.
| |||||||||||||||
|
|